10k A375 Cells Transduced with (1) Non-Target and (1) Target sgRNA
Dataset: 10k A375 Cells Transduced with (1) Non-Target and (1) Target sgRNA, Dual Indexed
The detailed description of this dataset can be found here.
Preparation
Download fastq files.
$ wget https://cg.10xgenomics.com/samples/cell-exp/4.0.0/SC3_v3_NextGem_DI_CRISPR_10K/SC3_v3_NextGem_DI_CRISPR_10K_fastqs.tar

$ tar xvf SC3_v3_NextGem_DI_PBMC_CSP_1K/SC3_v3_NextGem_DI_PBMC_CSP_1K_fastqs.tar
Combine reads of different lanes.
$ cat SC3_v3_NextGem_DI_CRISPR_10K_fastqs/SC3_v3_NextGem_DI_CRISPR_10K_crispr_fastqs/SC3_v3_NextGem_DI_CRISPR_10K_crispr_S1_L00?_R1_001.fastq.gz > SC3_v3_NextGem_DI_CRISPR_10K_crispr_S1_combined_R1_001.fastq.gz

$ cat SC3_v3_NextGem_DI_CRISPR_10K_fastqs/SC3_v3_NextGem_DI_CRISPR_10K_crispr_fastqs/SC3_v3_NextGem_DI_CRISPR_10K_crispr_S1_L00?_R2_001.fastq.gz > SC3_v3_NextGem_DI_CRISPR_10K_crispr_S1_combined_R2_001.fastq.gz
Download cell barcode info. These are the cell-associated barcodes in this single cell RNA-Seq library.
$ wget https://cf.10xgenomics.com/samples/cell-exp/4.0.0/SC3_v3_NextGem_DI_CRISPR_10K/SC3_v3_NextGem_DI_CRISPR_10K_filtered_feature_bc_matrix.tar.gz

$ tar zxvf SC3_v3_NextGem_DI_CRISPR_10K_filtered_feature_bc_matrix.tar.gz
Inspect cell barcodes.
$ gzip -dc filtered_feature_bc_matrix/barcodes.tsv.gz | head

AAACCCACACATAGCT-1
AAACCCACATCATGAC-1
AAACCCAGTCATCGGC-1
AAACCCAGTCGCACAC-1
AAACCCAGTGCAACGA-1
AAACCCATCAAGCGTT-1
AAACCCATCAGATGCT-1
AAACCCATCATCTACT-1
AAACCCATCCTTATGT-1
AAACCCATCTCGGCTT-1
Prepare feature barcodes.
$ wget https://cf.10xgenomics.com/samples/cell-exp/4.0.0/SC3_v3_NextGem_DI_CRISPR_10K/SC3_v3_NextGem_DI_CRISPR_10K_feature_ref.csv
Inspect feature barcode info.
$ cat SC3_v3_NextGem_DI_CRISPR_10K_feature_ref.csv

id,name,read,pattern,sequence,feature_type,target_gene_id,target_gene_name
RAB1A-2,RAB1A-2,R2,(BC)GTTTAAGAGCTAAGCTGGAA,GCCGGCGAACCAGGAAATA,CRISPR Guide Capture,ENSG00000138069,RAB1A
NON_TARGET-1,NON_TARGET-1,R2,(BC)GTTTAAGAGCTAAGCTGGAA,AACGTGCTGACGATGCGGGC,CRISPR Guide Capture,Non-Targeting,Non-Targeting
Clean up.
$ cut -d ',' -f1,5 SC3_v3_NextGem_DI_CRISPR_10K_feature_ref.csv | sed 's/,/\t/g' | tail -2 > SC3_v3_NextGem_DI_CRISPR_10K_feature_ref.tsv

$ cat SC3_v3_NextGem_DI_CRISPR_10K_feature_ref.tsv

RAB1A-2 GCCGGCGAACCAGGAAATA
NON_TARGET-1    AACGTGCTGACGATGCGGGC
QC
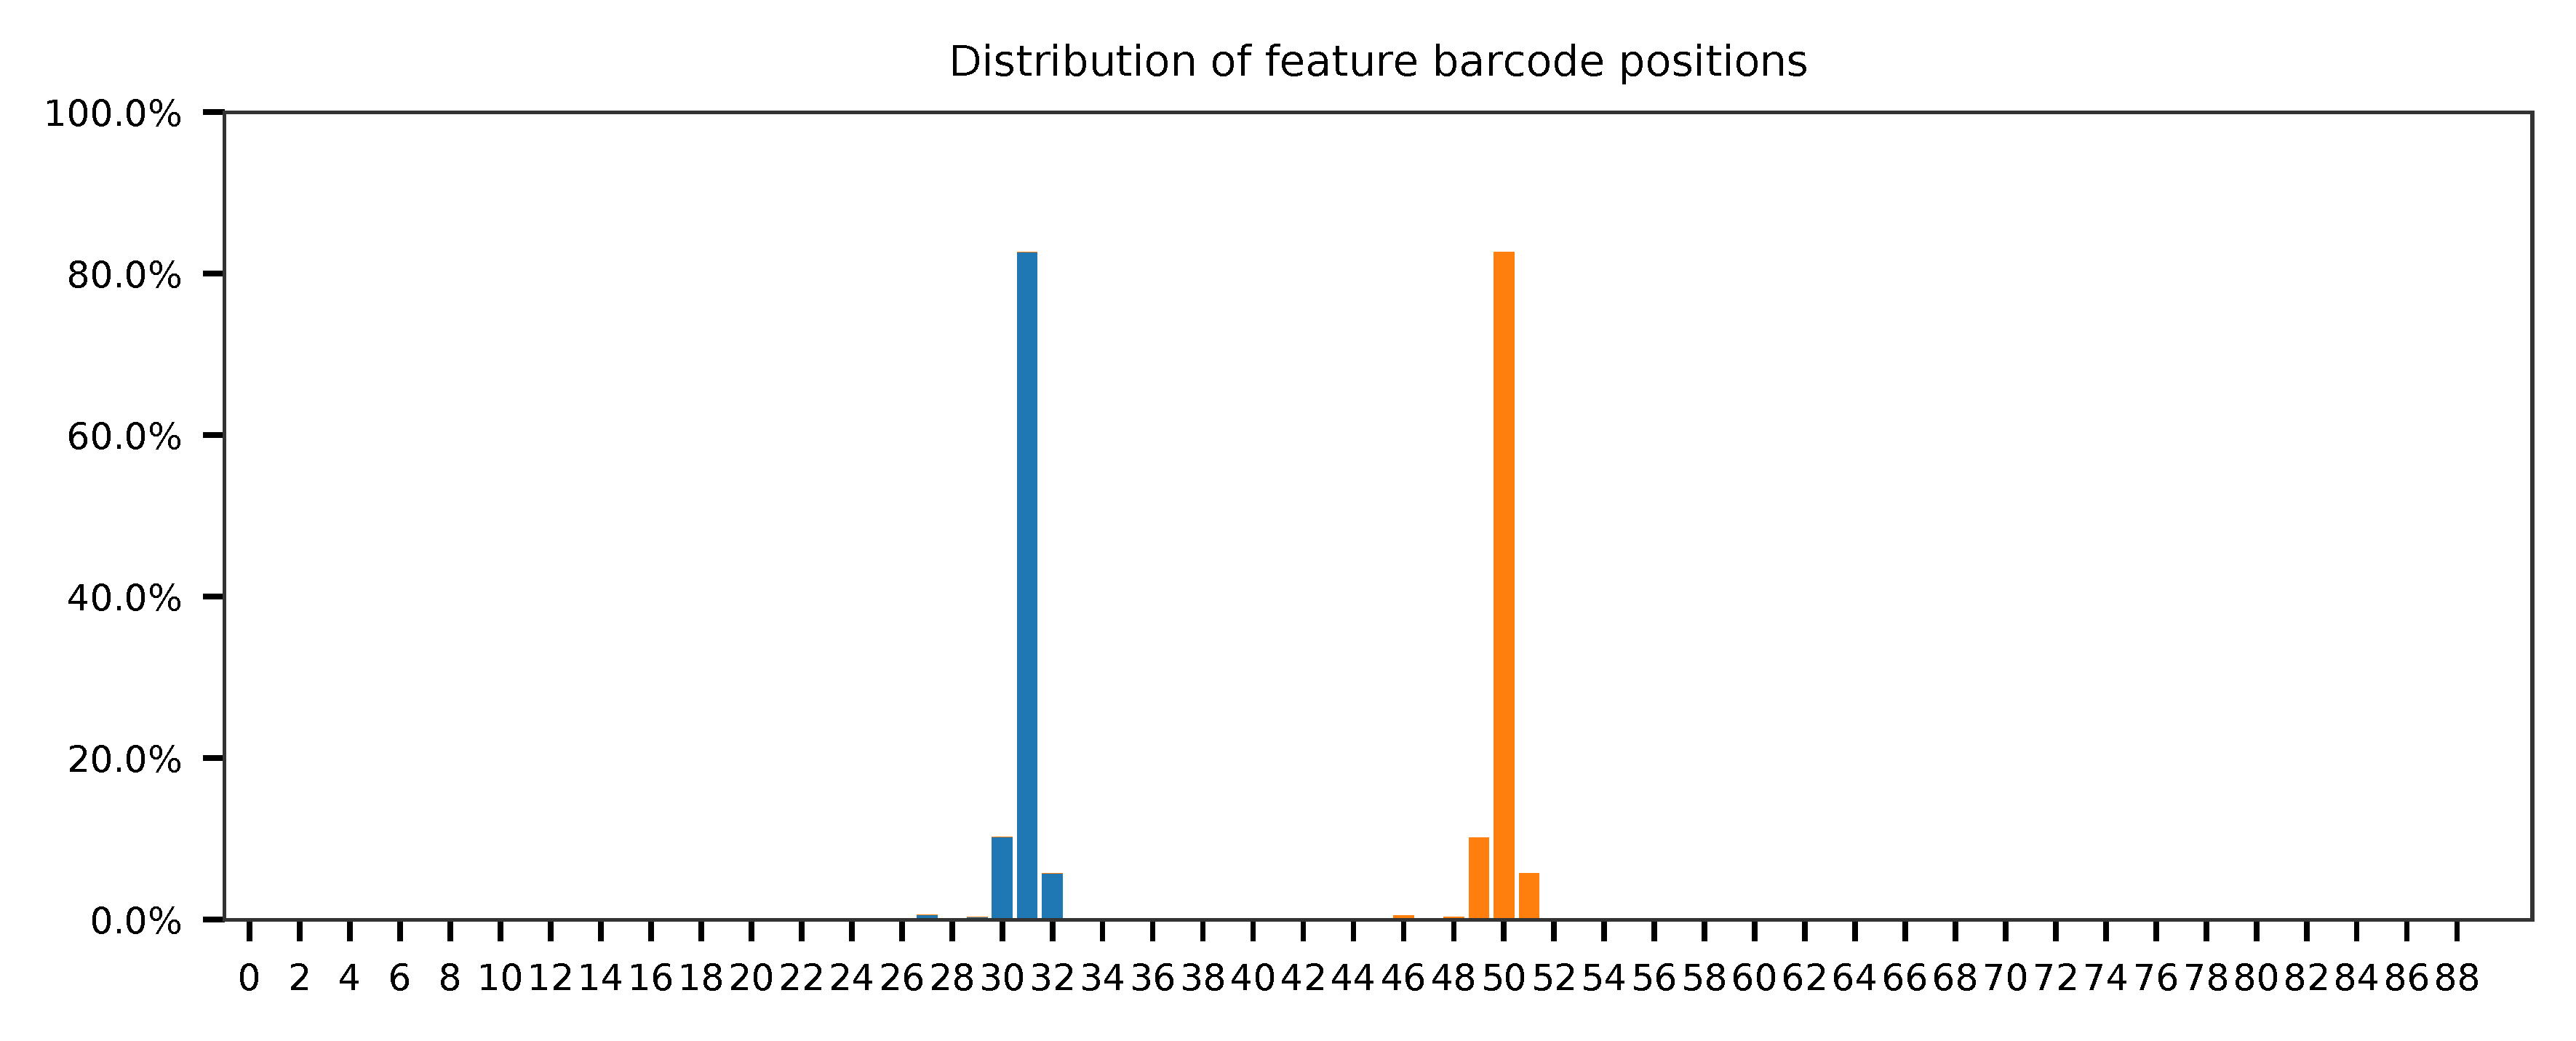
Sample the first 20,000 (set by -n, default 100,000) read pairs for quality control. Use -t to set the number of threads. By default, the diagnostic results and plots are generated in the qc directory (set by --output_directory), and full length of read 1 and read 2 are searched against reference cell and feature barcodes, respectively. The per base content of both read pairs and the distribution of matched barcode positions are summarized. Use -r1_c and/or -r2_c to limit the search range. Use -cb_n and/or -fb_n to set the mismatch tolerance for cell and feature barcode matching (default 3).
$ fba qc \
    -1 SC3_v3_NextGem_DI_CRISPR_10K_crispr_S1_combined_R1_001.fastq.gz \
    -2 SC3_v3_NextGem_DI_CRISPR_10K_crispr_S1_combined_R2_001.fastq.gz \
    -w filtered_feature_bc_matrix/barcodes.tsv.gz \
    -f SC3_v3_NextGem_DI_CRISPR_10K_feature_ref.tsv \
    -r1_c 0,16 \
    -n 20000
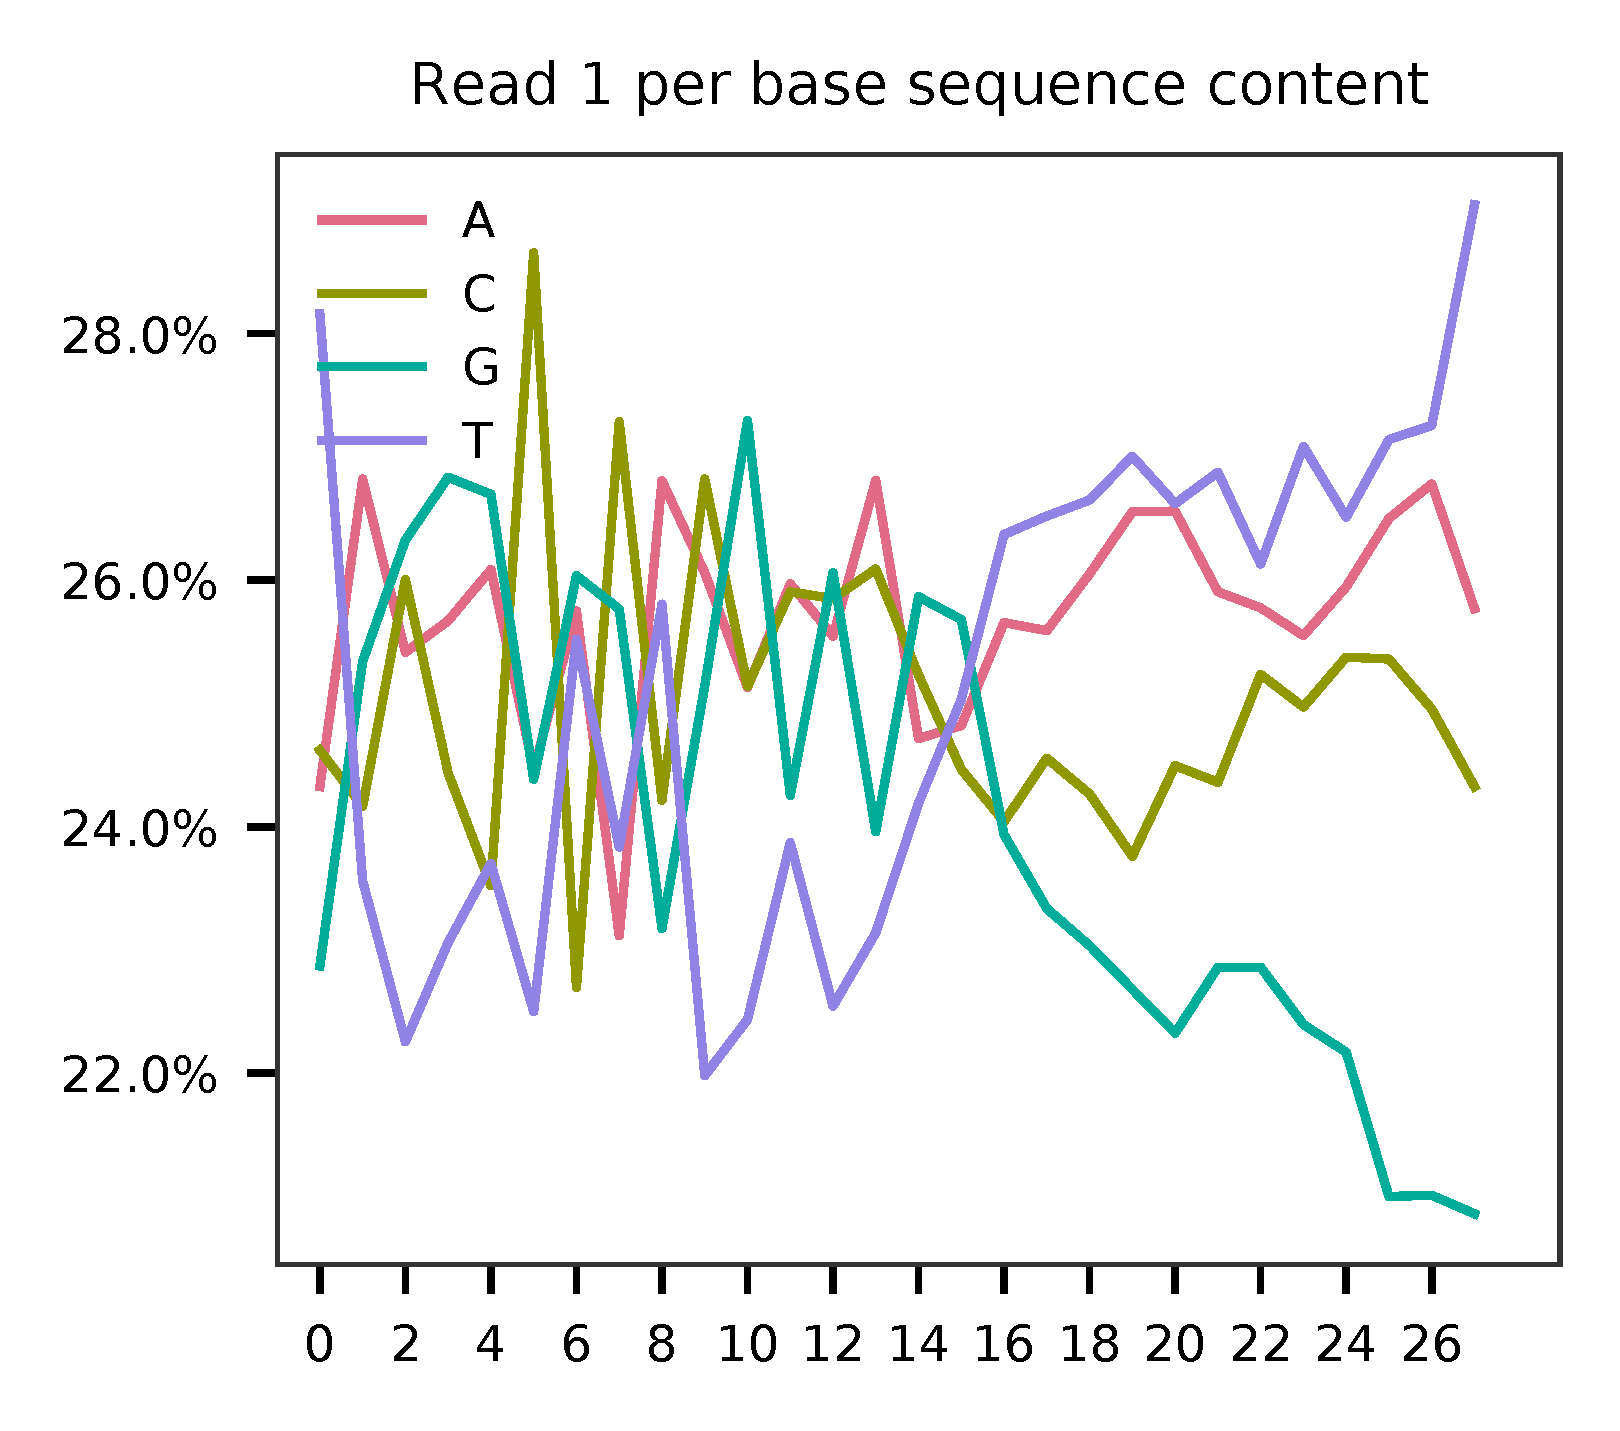
This library is built using the Chromium Next GEM Single Cell 3ʹ Reagent Kits v3.1 (Dual Index) with Feature Barcode technology for CRISPR Screening and sequenced on Illumina NovaSeq 6000. The first 16 bases are cell barcodes and the following 12 bases are UMIs. Based on the base content plot, the GC content of cell barcodes are quite even. The UMIs are slightly T enriched.
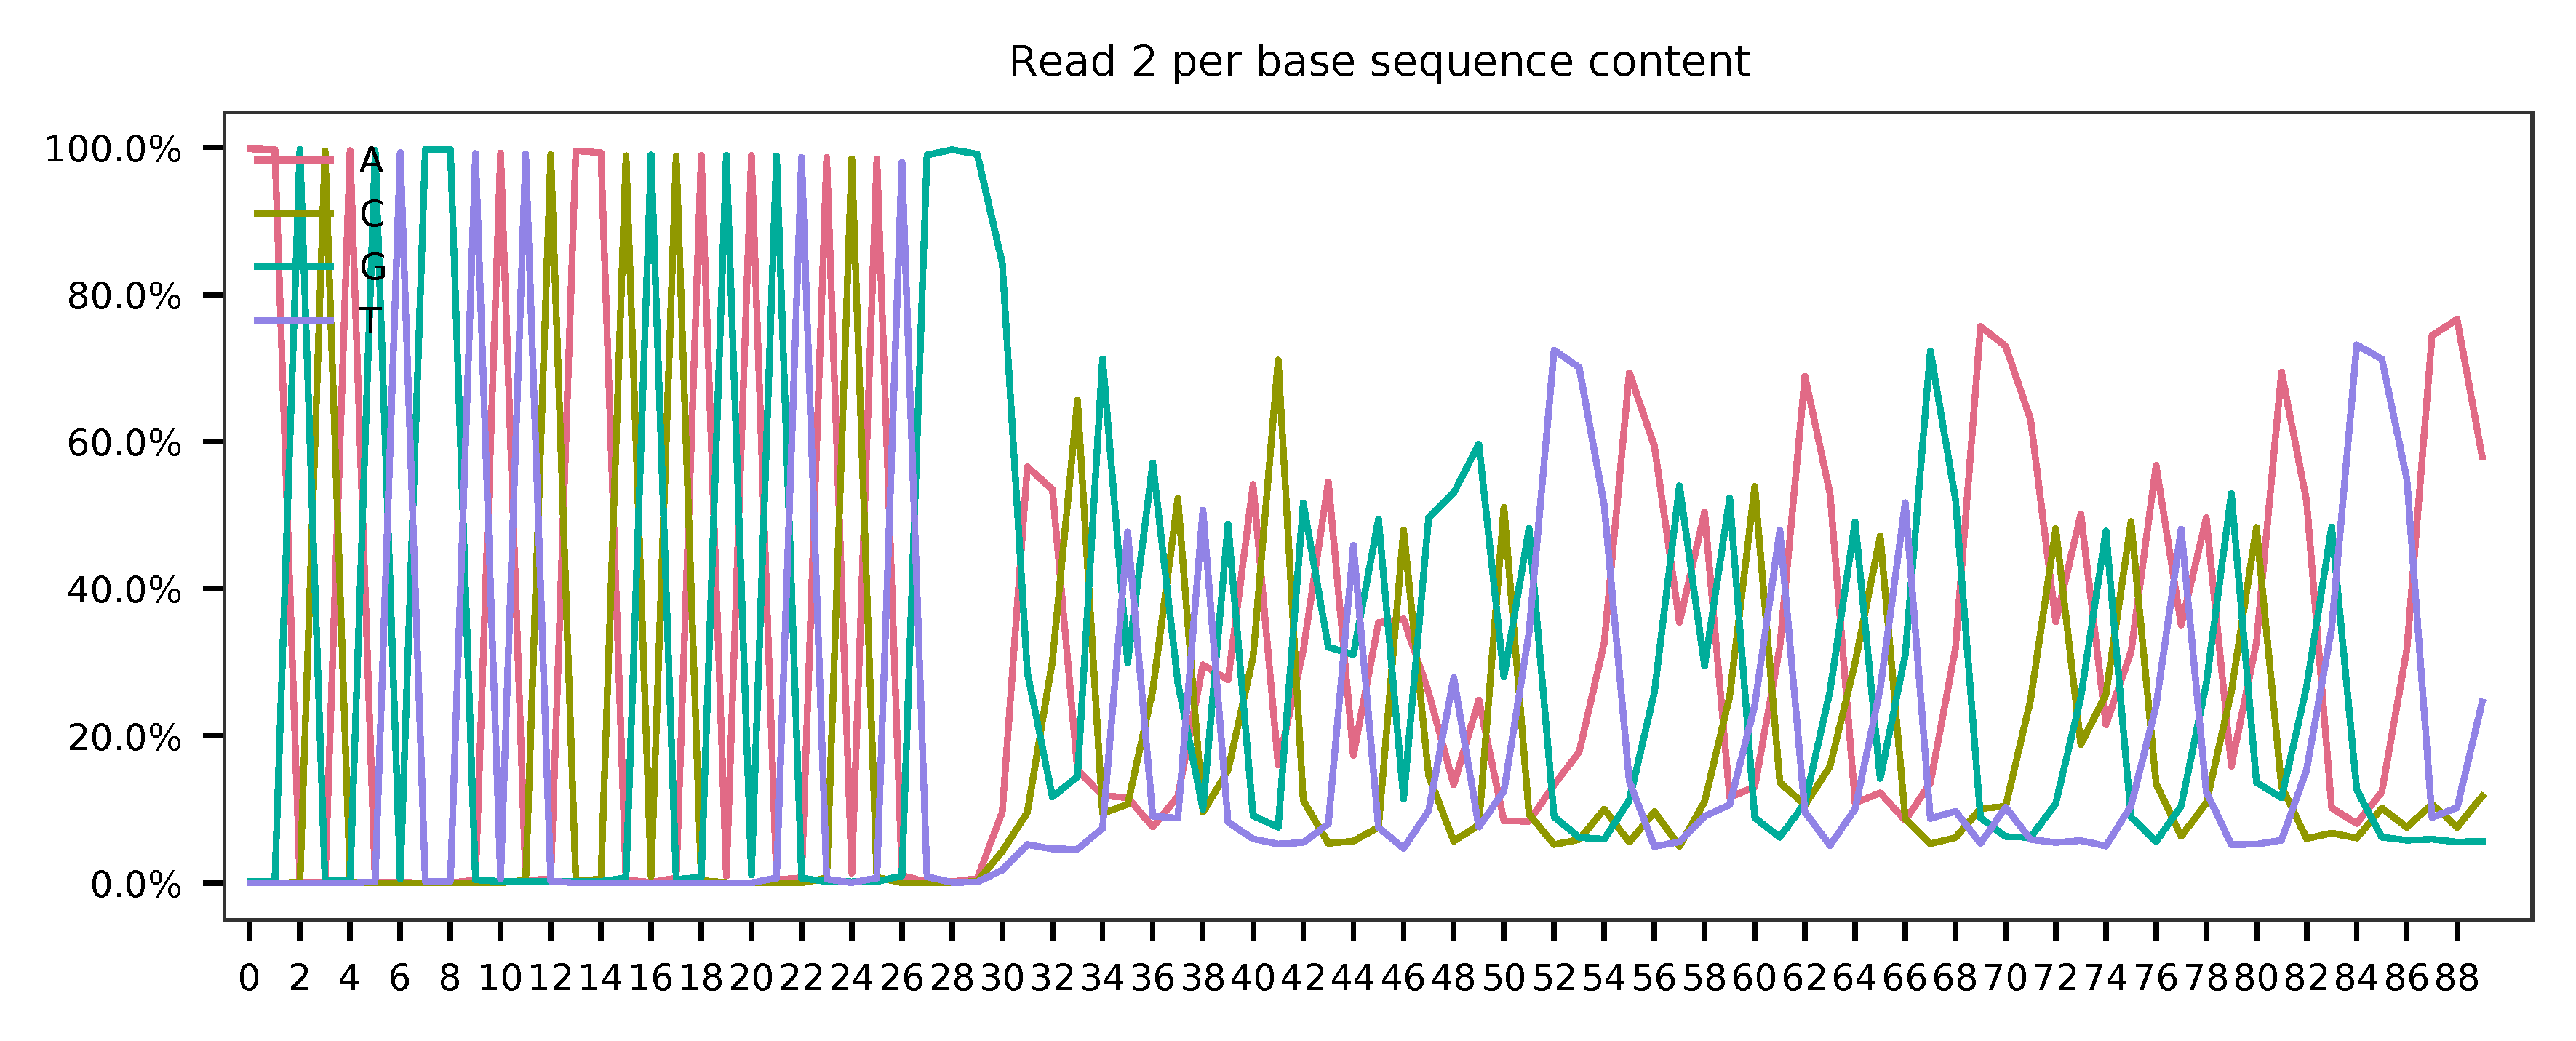
As for read 2, based on the per base content, it suggests that bases 0-31 are constant and we can almost read the bases. They are actually Template Switch Oligo (TSO) sequence. Starting from base 32, it seems there are two genotypes for the reads we have sampled.
The detailed qc results are stored in feature_barcoding_output.tsv.gz file. matching_pos columns indicate the matched positions on reads. matching_description columns indicate mismatches in substitutions:insertions:deletions format.
$ gzip -dc qc/feature_barcoding_output.tsv.gz | head

read1_seq       cell_barcode    cb_matching_pos cb_matching_description read2_seq       feature_barcode fb_matching_pos fb_matching_description
CNCCACACACGTGTTAatgagtactagc    CCTCACACACGTAGTT        0:15    2:0:1   AAGCAGTGGTATCAACGCAGAGTACATGGGATAGGTTTGGTCCTAGCCTTTCTATTAGCTCTTAGTAAGATTACACATGCAAGCATCCCC    no_match        NA      NA
GNCGCGATCAGCATTActtttgtcaccc    GTCGCGAAGAGCATTA        0:16    3:0:0   AAGCAGTGGTATCAACGCAGAGTACATGGGGACTGTTGCTGGTGTGTACTTGCTAAGGTTTATGTCAGTTCAAGATTATAAGCCCCCCAG    no_match        NA      NA
TNGGAAGGTAAGTGTAatcgagggaaca    TGGGAAGCAAAGTGTA        0:16    3:0:0   AAGCAGTGGTATCAACGCAGAGTACATGGGGGCCGGCGAACCAGGAAATAGTTTAAGAGCTAAGCTGGAAACAGCATAGCAAGTTTAAAT    RAB1A-2_GCCGGCGAACCAGGAAATAG    31:51   0:0:0
CNCCCAAGTCGATAGGgagcgcaagcat    CCCAACTCACGATAGG        2:16    1:0:2   AAGCAGTGGTATCAACGCAGAGTACATGGGGGCCGGCGAACCAGGAAATAGTTTAAGAGCTAAGCTGGAAACAGCATAGCAAGTTTAAAT    RAB1A-2_GCCGGCGAACCAGGAAATAG    31:51   0:0:0
CNCACTGCAAACGGTGggcgtaaatgag    CTCACTGGTAACGGTG        0:16    3:0:0   AAGCAGTGGTATCAACGCAGAGTACATGGGGGCCGGCGAACCAGGAAATAGTTTAAGAGCTAAGCTGGAAACAGCATAGCAAGTTTAAAT    RAB1A-2_GCCGGCGAACCAGGAAATAG    31:51   0:0:0
ANCATCACAGGCGCTTgtcccactatat    AGCATCAGTGGCGCTT        0:16    3:0:0   AAGCAGTGGTATCAACGCAGAGTACATGGGGGCCGGCGAACCAGGAAATAGTTTAAGAGCTAAGCTGGAAACAGCATAGCAAGTTTAAAT    RAB1A-2_GCCGGCGAACCAGGAAATAG    31:51   0:0:0
ANACGAACACTTTCATccaaaagaagtt    AAACGAAGTCTTTCAT        0:16    3:0:0   AAGCAGTGGTATCAACGCAGAGTACATGGGGGCCGGCGAACCAGGAAATAGTTTAAGAGCTAAGCTGGAAACAGCATAGCAAGTTTAAAT    RAB1A-2_GCCGGCGAACCAGGAAATAG    31:51   0:0:0
ANCAACCAGTATCGTTgaaatcctggta    AACAACCTCTATCGTT        0:16    3:0:0   AAGCAGTGGTATCAACGCAGAGTACATGGGGAACGTGCTGACGATGCGGGCGTTTAAGAGCTAAGCTGGAAACAGCATAGCAAGTTTAAA    NON_TARGET-1_AACGTGCTGACGATGCGGGC       31:51   0:0:0
GNAGCCCGTACCACATgggcccagtatg    GAAGCCCCAACCACAT        0:16    3:0:0   AAGCAGTGGTATCAACGCAGAGTACATGGGGGCCGGCGAACCAGGAAATAGTTTAAGAGCTAAGCTGGAAACAGCATAGCAAGTTTAAAT    RAB1A-2_GCCGGCGAACCAGGAAATAG    31:51   0:0:0
Barcode extraction
Although the lengths of the two feature barcodes are one base different, they all start at the same position on read 2. For the purpose of feature barcode identification, let’s include one extra downstream base (G) for the RAB1A-2 feature barcode to make their lengths equal.
$ cat SC3_v3_NextGem_DI_CRISPR_10K_feature_ref_edited.tsv

RAB1A-2 GCCGGCGAACCAGGAAATAG
NON_TARGET-1    AACGTGCTGACGATGCGGGC
Search ranges are set to 0,16 on read 1 and 31,51 on read 2. Two mismatches for cell and feature barcodes (-cb_m, -cf_m) are allowed.
$ fba extract \
    -1 SC3_v3_NextGem_DI_CRISPR_10K_crispr_S1_combined_R1_001.fastq.gz \
    -2 SC3_v3_NextGem_DI_CRISPR_10K_crispr_S1_combined_R2_001.fastq.gz \
    -w filtered_feature_bc_matrix/barcodes.tsv.gz \
    -f SC3_v3_NextGem_DI_CRISPR_10K_feature_ref_edited.tsv \
    -o feature_barcoding_output.tsv.gz \
    -r1_c 0,16 \
    -r2_c 31,51 \
    -cb_m 2 \
    -fb_m 2
Preview of result.
$ gzip -dc feature_barcoding_output.tsv.gz  | head

read1_seq       cell_barcode    cb_num_mismatches       read2_seq       feature_barcode fb_num_mismatches
GGCAGTCTCCGTTACTtatccagccttc    GGCAGTCTCGGTAACT        2       aagcagtggtatcaacgcagagtacatggggGCCGGCGAACCAGGAAATAGtttaagagctaagctggaaacagcatagcaagtttaaat    RAB1A-2_GCCGGCGAACCAGGAAATAG     0
TTACGTTGTGAATCGGgtggggctcttc    TTACGTTCAGAATCGG        2       aagcagtggtatcaacgcagagtacatggggAACGTGCTGACGATGCGGGCgtttaagagctaagctggaaacagcatagcaagtttaaa    NON_TARGET-1_AACGTGCTGACGATGCGGGC        0
TCGGGCAAGGATTGGTttctactcggaa    TCGGGCATCGATTGGT        2       aagcagtggtatcaacgcagagtacatgggaACGTGCTGACGATGCGGGCGtttaagagctaagctggaaacagcatagcaagtttaaat    NON_TARGET-1_AACGTGCTGACGATGCGGGC        2
ACAACCACACATCTAGcggcatcatact    ACAACCAGTCATCTAG        2       aagcagtggtatcaacgcagagtacatggggCCGGCGAACCAGGAAATAGTttaagagctaagctggaaacagcatagcaagtttaaata    RAB1A-2_GCCGGCGAACCAGGAAATAG     2
AGACTCAAGTGCTAGAacagaactggtg    AGACTCATCTGCTAGA        2       aagcagtggtatcaacgcagagtacatggggAACGTGCTGACGATGCGGGCgtttaagagctaagctggaaacagcatagcaagtttaaa    NON_TARGET-1_AACGTGCTGACGATGCGGGC        0
GAGTTGTTCGAACATTctgcccgacgtc    GAGTTGTAGGAACATT        2       aagcagtggtatcaacgcagagtacatggggAACGTGCTGACGATGCGGGCgtttaagagctaagctggaaacagcatagcaagtttaaa    NON_TARGET-1_AACGTGCTGACGATGCGGGC        0
AGACTCAGTGGCACAAtgtcagaattca    AGACTCACAGGCACAA        2       aagcagtggtatcaacgcagagtacatggggGCCGGCGAACCAGGAAATAGtttaagagctaagctggaaacagcatagcaagtttaaat    RAB1A-2_GCCGGCGAACCAGGAAATAG     0
TGCACGGAGGATAACCcgtgcacgtaca    TGCACGGTCGATAACC        2       aagcagtggtatcaacgcagagtacatggggGCCGGCGAACCAGGAAATAGtttaagagctaagctggaaacagcatagcaagtttaaat    RAB1A-2_GCCGGCGAACCAGGAAATAG     0
CGTAGTAGTAACACGGaagagggaactg    CGTAGTAGTAACGCGA        2       aagcagtggtatcaacgcagagtacatggggAACGTGCTGACGATGCGGGCgtttaagagctaagctggaaacagcatagcaagtttaaa    NON_TARGET-1_AACGTGCTGACGATGCGGGC        0
Result summary.
64.7% (93,795,979 out of 145,032,428) of total read pairs have valid cell and feature barcodes. Majority of fragments in this library have correct structure.
2021-02-15 01:51:59,262 - fba.__main__ - INFO - fba version: 0.0.7
2021-02-15 01:51:59,262 - fba.__main__ - INFO - Initiating logging ...
2021-02-15 01:51:59,262 - fba.__main__ - INFO - Python version: 3.7
2021-02-15 01:51:59,262 - fba.__main__ - INFO - Using extract subcommand ...
2021-02-15 01:51:59,276 - fba.levenshtein - INFO - Number of reference cell barcodes: 11,791
2021-02-15 01:51:59,276 - fba.levenshtein - INFO - Number of reference feature barcodes: 2
2021-02-15 01:51:59,276 - fba.levenshtein - INFO - Read 1 coordinates to search: [0, 16)
2021-02-15 01:51:59,276 - fba.levenshtein - INFO - Read 2 coordinates to search: [31, 51)
2021-02-15 01:51:59,276 - fba.levenshtein - INFO - Cell barcode maximum number of mismatches: 2
2021-02-15 01:51:59,276 - fba.levenshtein - INFO - Feature barcode maximum number of mismatches: 2
2021-02-15 01:51:59,276 - fba.levenshtein - INFO - Read 1 maximum number of N allowed: 3
2021-02-15 01:51:59,276 - fba.levenshtein - INFO - Read 2 maximum number of N allowed: 3
2021-02-15 01:52:02,510 - fba.levenshtein - INFO - Matching ...
2021-02-15 02:20:39,807 - fba.levenshtein - INFO - Read pairs processed: 10,000,000
2021-02-15 02:49:04,142 - fba.levenshtein - INFO - Read pairs processed: 20,000,000
2021-02-15 03:17:27,422 - fba.levenshtein - INFO - Read pairs processed: 30,000,000
2021-02-15 03:45:54,615 - fba.levenshtein - INFO - Read pairs processed: 40,000,000
2021-02-15 04:14:23,049 - fba.levenshtein - INFO - Read pairs processed: 50,000,000
2021-02-15 04:42:49,377 - fba.levenshtein - INFO - Read pairs processed: 60,000,000
2021-02-15 05:11:15,736 - fba.levenshtein - INFO - Read pairs processed: 70,000,000
2021-02-15 05:39:43,011 - fba.levenshtein - INFO - Read pairs processed: 80,000,000
2021-02-15 06:08:09,940 - fba.levenshtein - INFO - Read pairs processed: 90,000,000
2021-02-15 06:36:39,658 - fba.levenshtein - INFO - Read pairs processed: 100,000,000
2021-02-15 07:05:08,115 - fba.levenshtein - INFO - Read pairs processed: 110,000,000
2021-02-15 07:33:32,101 - fba.levenshtein - INFO - Read pairs processed: 120,000,000
2021-02-15 08:02:01,233 - fba.levenshtein - INFO - Read pairs processed: 130,000,000
2021-02-15 08:30:29,660 - fba.levenshtein - INFO - Read pairs processed: 140,000,000
2021-02-15 08:44:47,038 - fba.levenshtein - INFO - Number of read pairs processed: 145,032,428
2021-02-15 08:44:47,038 - fba.levenshtein - INFO - Number of read pairs w/ valid barcodes: 93,795,979
2021-02-15 08:44:47,153 - fba.__main__ - INFO - Done.
Matrix generation
Only fragments with correct (passed the criteria) cell and feature barcodes are included. UMI removal is powered by UMI-tools (Smith, T., et al. 2017. Genome Res. 27, 491–499.). Use -us to set the UMI starting position on read 1 (default 16). Use -ul to set the UMI length (default 12). Fragments with UMI length less than this value are discarded. UMI deduplication method is set by -ud (default directional). Use -um to set UMI deduplication mismatch threshold (default 1).
The generated feature count matrix can be easily imported into well-established single cell analysis packages: Seruat and Scanpy.
$ fba count \
    -i feature_barcoding_output.tsv.gz \
    -o matrix_featurecount.csv.gz \
    -us 16 \
    -ul 12 \
    -um 1 \
    -ud directional
Result summary.
7.6% (7,145,799 out of 93,795,979) of read pairs with valid cell and feature barcodes are unique fragments. 4.9% (7,143,943 out of 145,032,428) of total sequenced read pairs contribute to the final matrix.
2020-10-20 04:47:32,738 - fba.__main__ - INFO - fba version: 0.0.7
2020-10-20 04:47:32,738 - fba.__main__ - INFO - Initiating logging ...
2020-10-20 04:47:32,738 - fba.__main__ - INFO - Python version: 3.7
2020-10-20 04:47:32,738 - fba.__main__ - INFO - Using count subcommand ...
2020-10-20 04:47:32,738 - fba.count - INFO - UMI-tools version: 1.0.1
2020-10-20 04:47:32,795 - fba.count - INFO - UMI starting position on read 1: 16
2020-10-20 04:47:32,795 - fba.count - INFO - UMI length: 12
2020-10-20 04:47:32,795 - fba.count - INFO - UMI-tools deduplication threshold: 1
2020-10-20 04:47:32,795 - fba.count - INFO - UMI-tools deduplication method: directional
2020-10-20 04:47:32,795 - fba.count - INFO - Header line: read1_seq cell_barcode cb_num_mismatches read2_seq feature_barcode fb_num_mismatches
2020-10-20 04:51:50,886 - fba.count - INFO - Number of lines processed: 93,795,979
2020-10-20 04:51:50,893 - fba.count - INFO - Number of cell barcodes detected: 11,758
2020-10-20 04:51:50,894 - fba.count - INFO - Number of features detected: 2
2020-10-20 05:00:42,298 - fba.count - INFO - Total UMIs after deduplication: 7,145,799
2020-10-20 05:00:42,320 - fba.count - INFO - Median number of UMIs per cell: 477.0
2020-10-20 05:00:42,434 - fba.__main__ - INFO - Done.
Demultiplexing
Negative binomial distribution
Cells are classified based on the feature count matrix. Demultiplexing method 1 (set by -dm) is implemented based on the method described by Stoeckius, M., et al. (2018) with some modifications. A cell identity matrix is generated in the output directory (set by --output_directory, default demultiplexed): 0 means negative, 1 means positive. Use -q to set the quantile threshold for demulitplexing. Set -v to create visualization plots.
$ fba demultiplex \
    -i matrix_featurecount.csv.gz \
    --output_directory demultiplexed \
    -dm 1 \
    -q 0.75 \
    -v
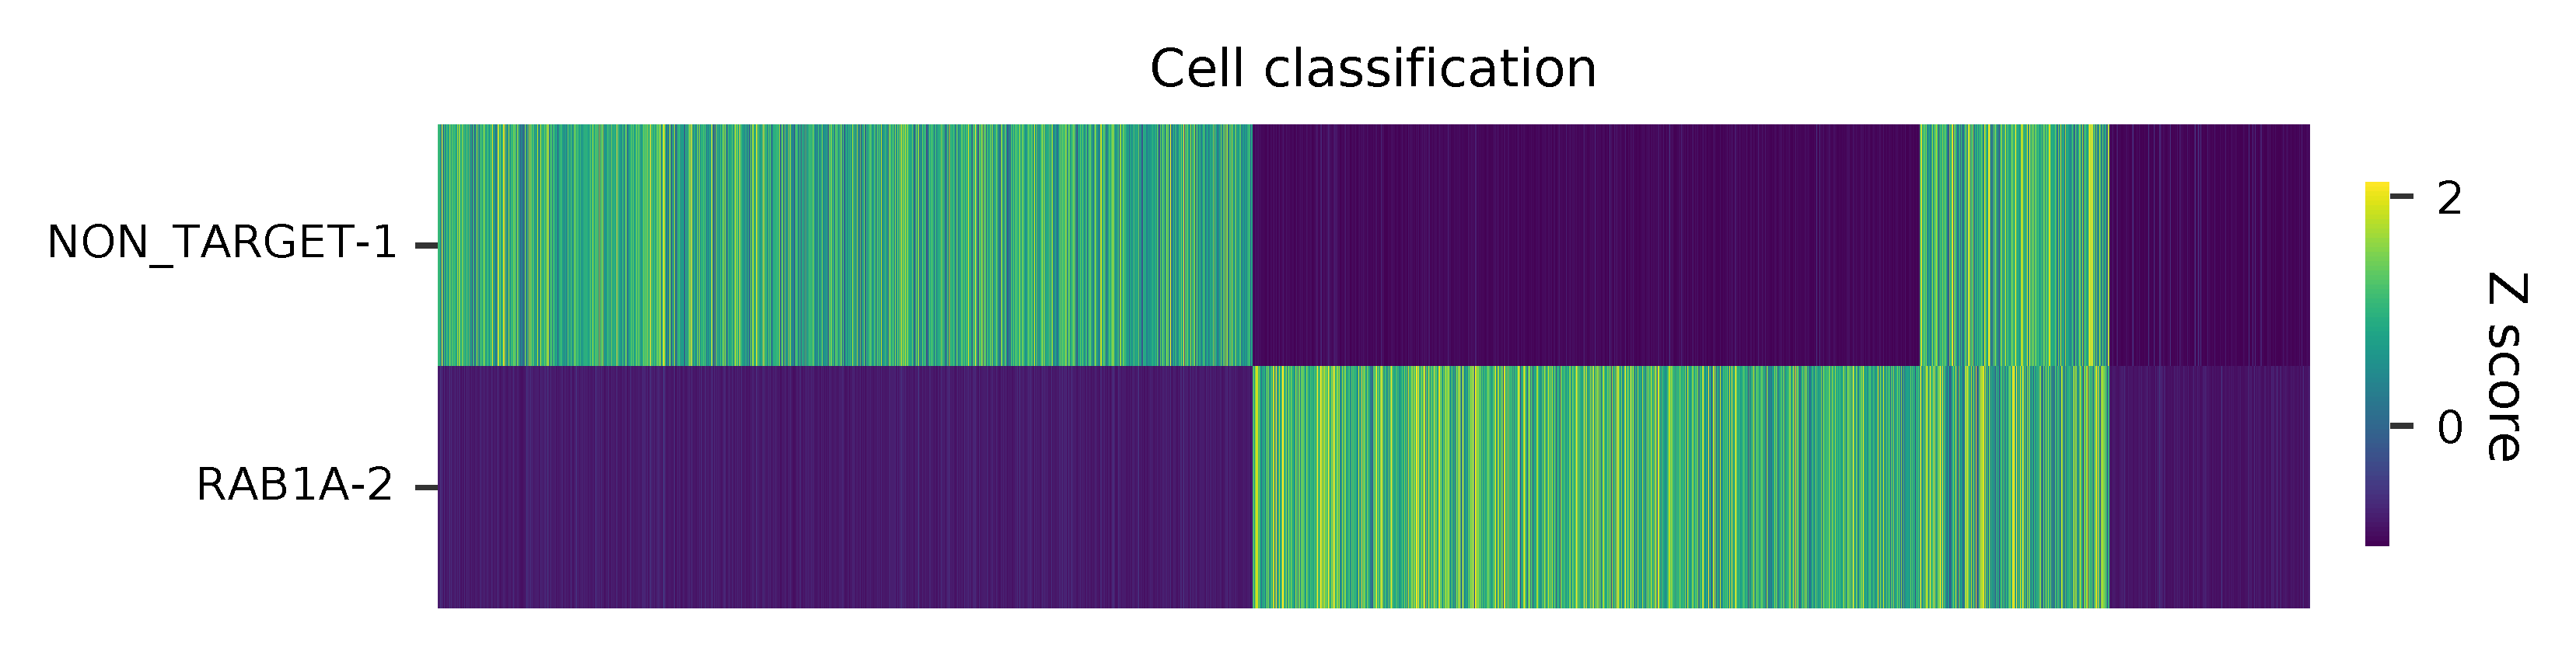
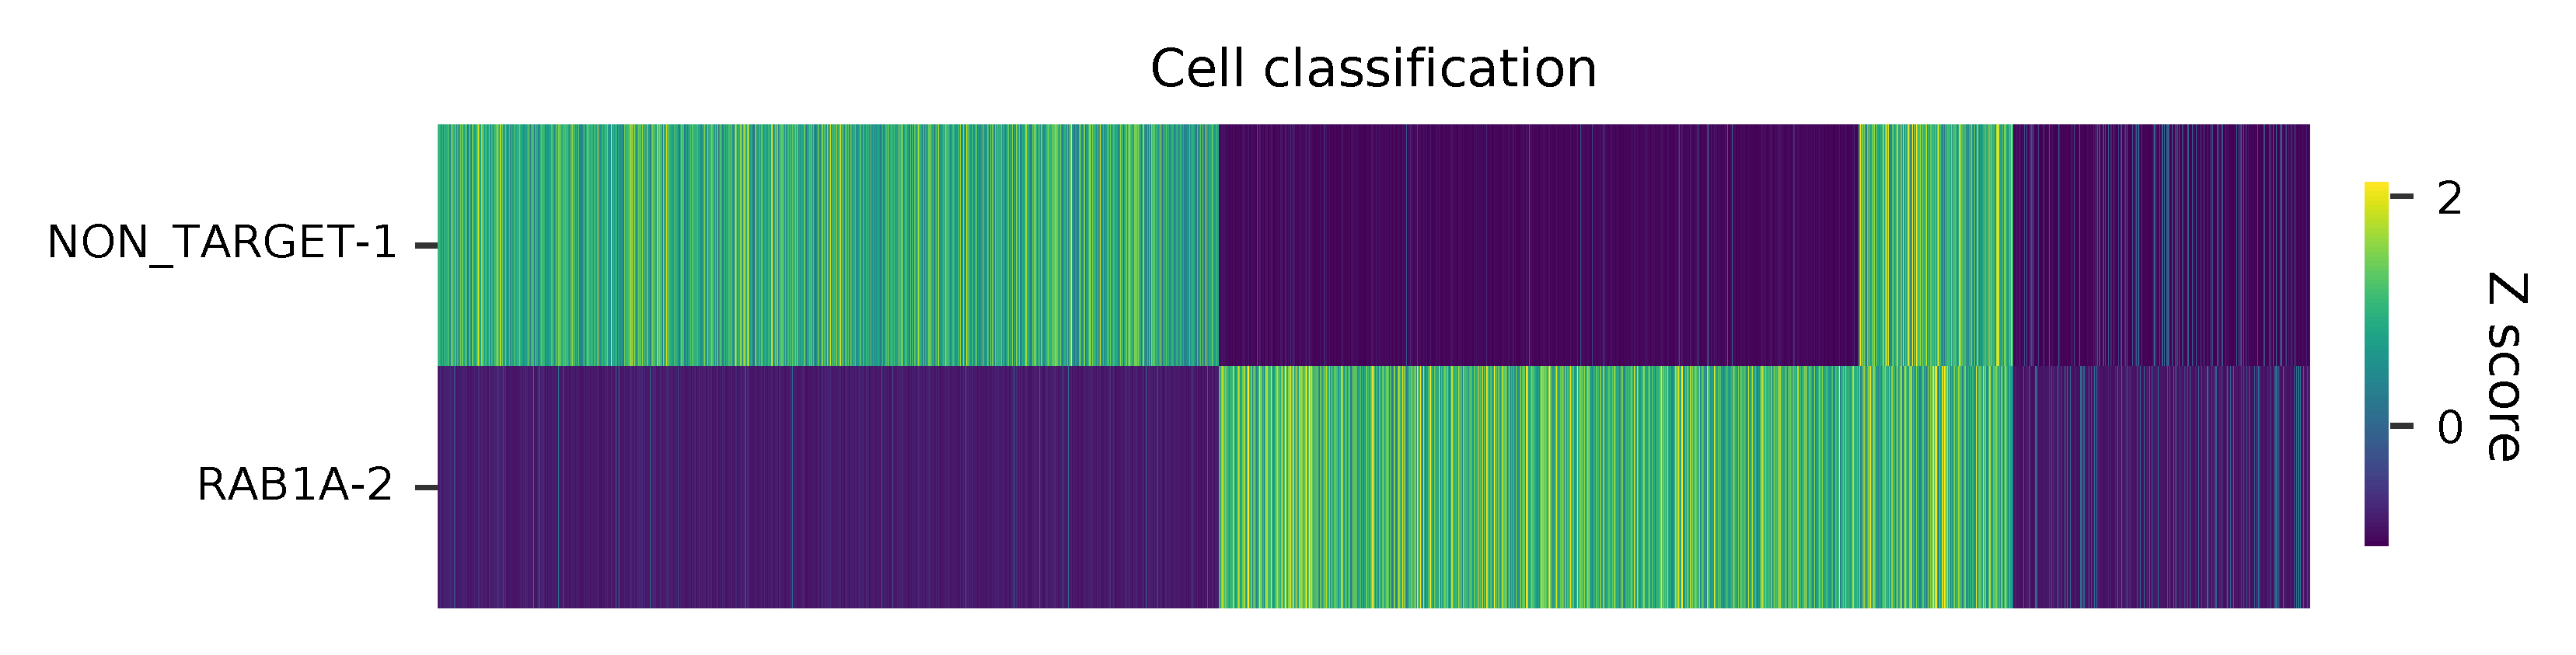
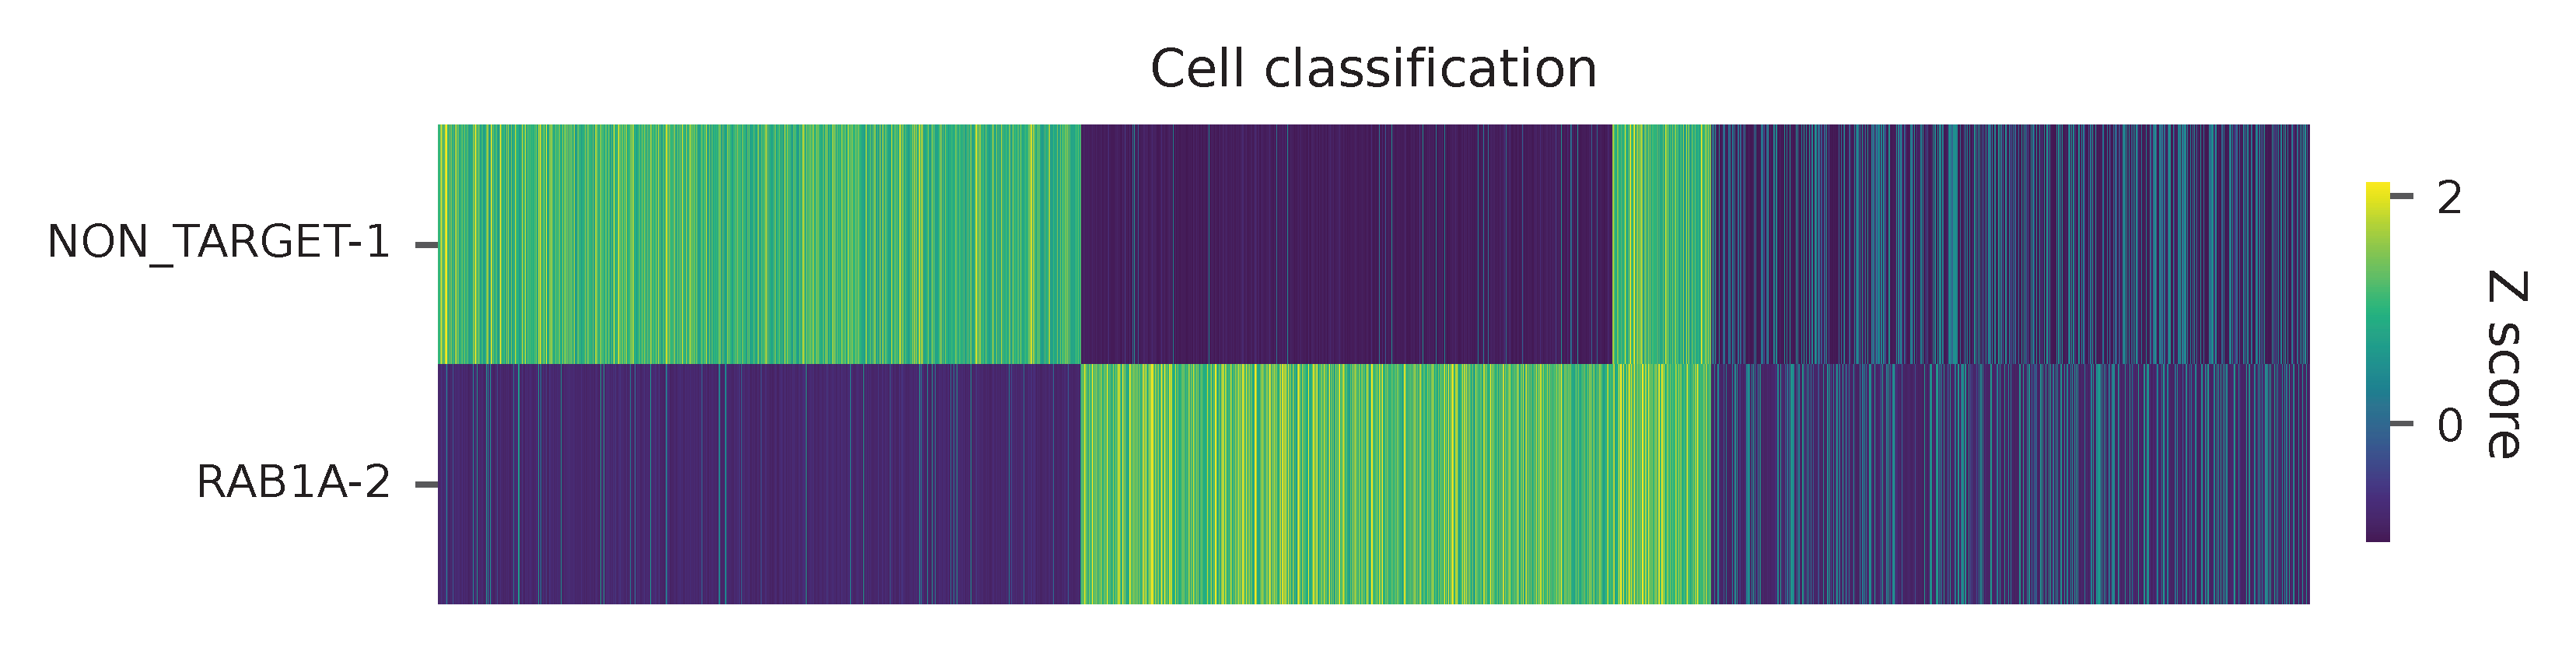
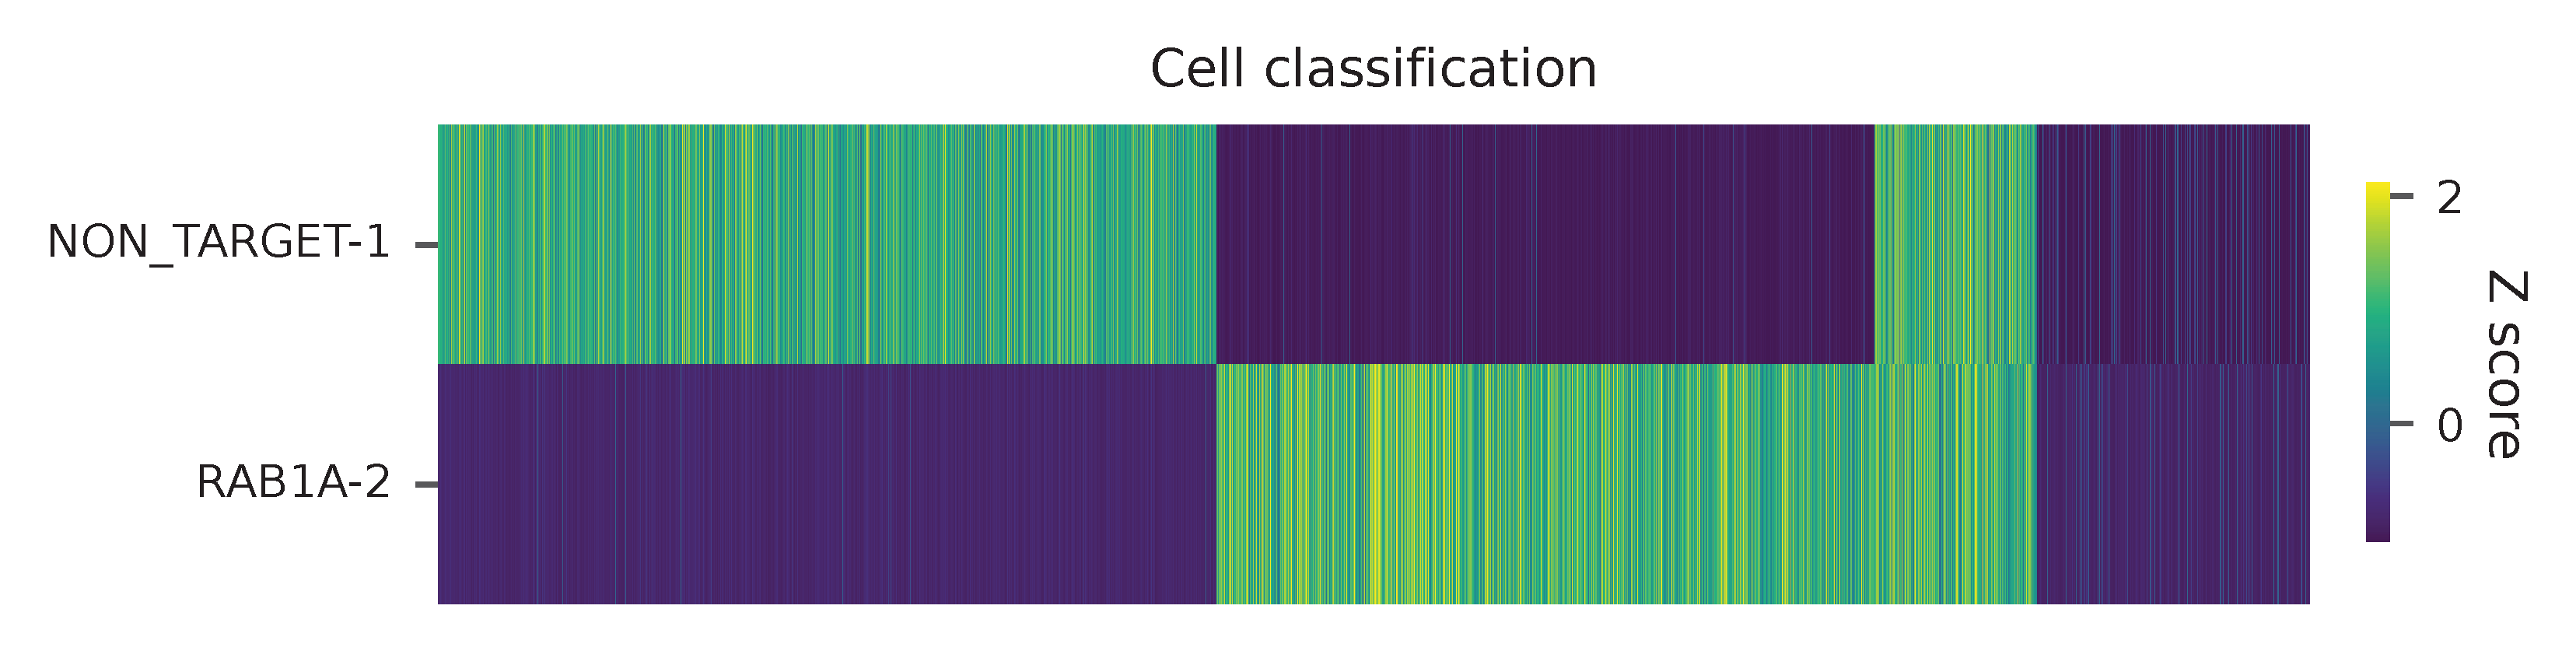
Heatmap of the relative abundance of features (sgRNAs) across all cells. Each column represents a single cell.
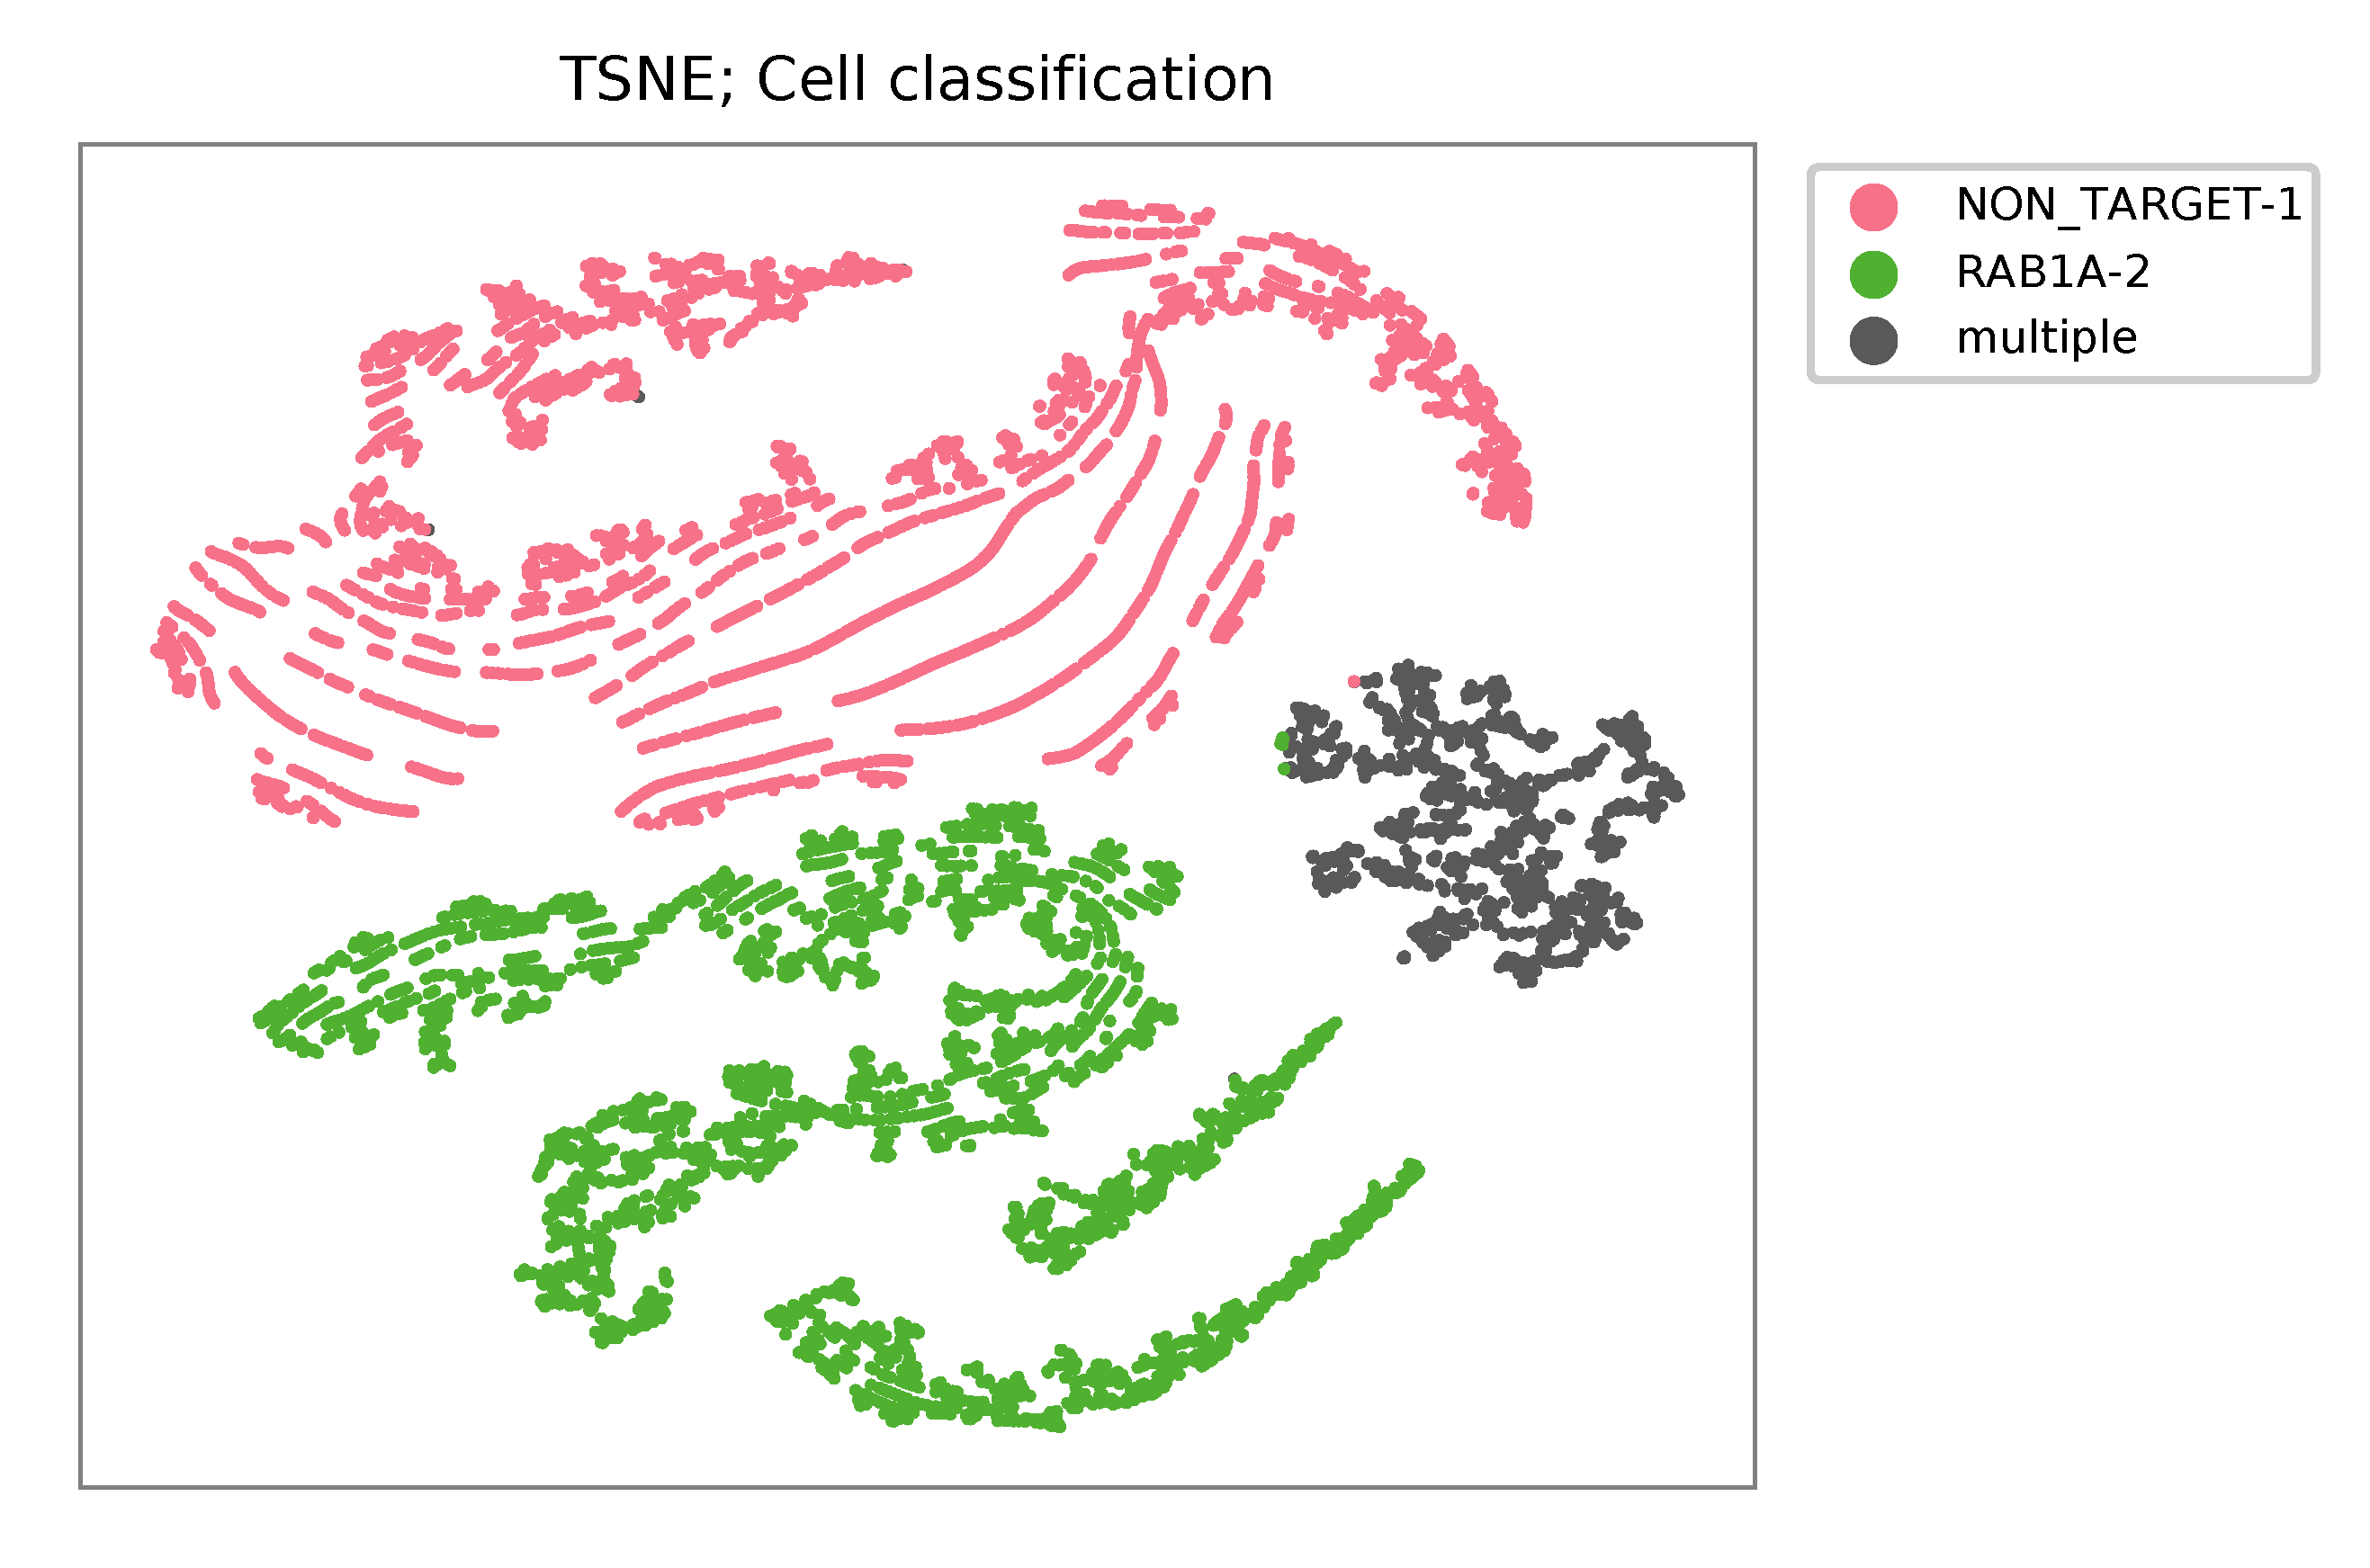
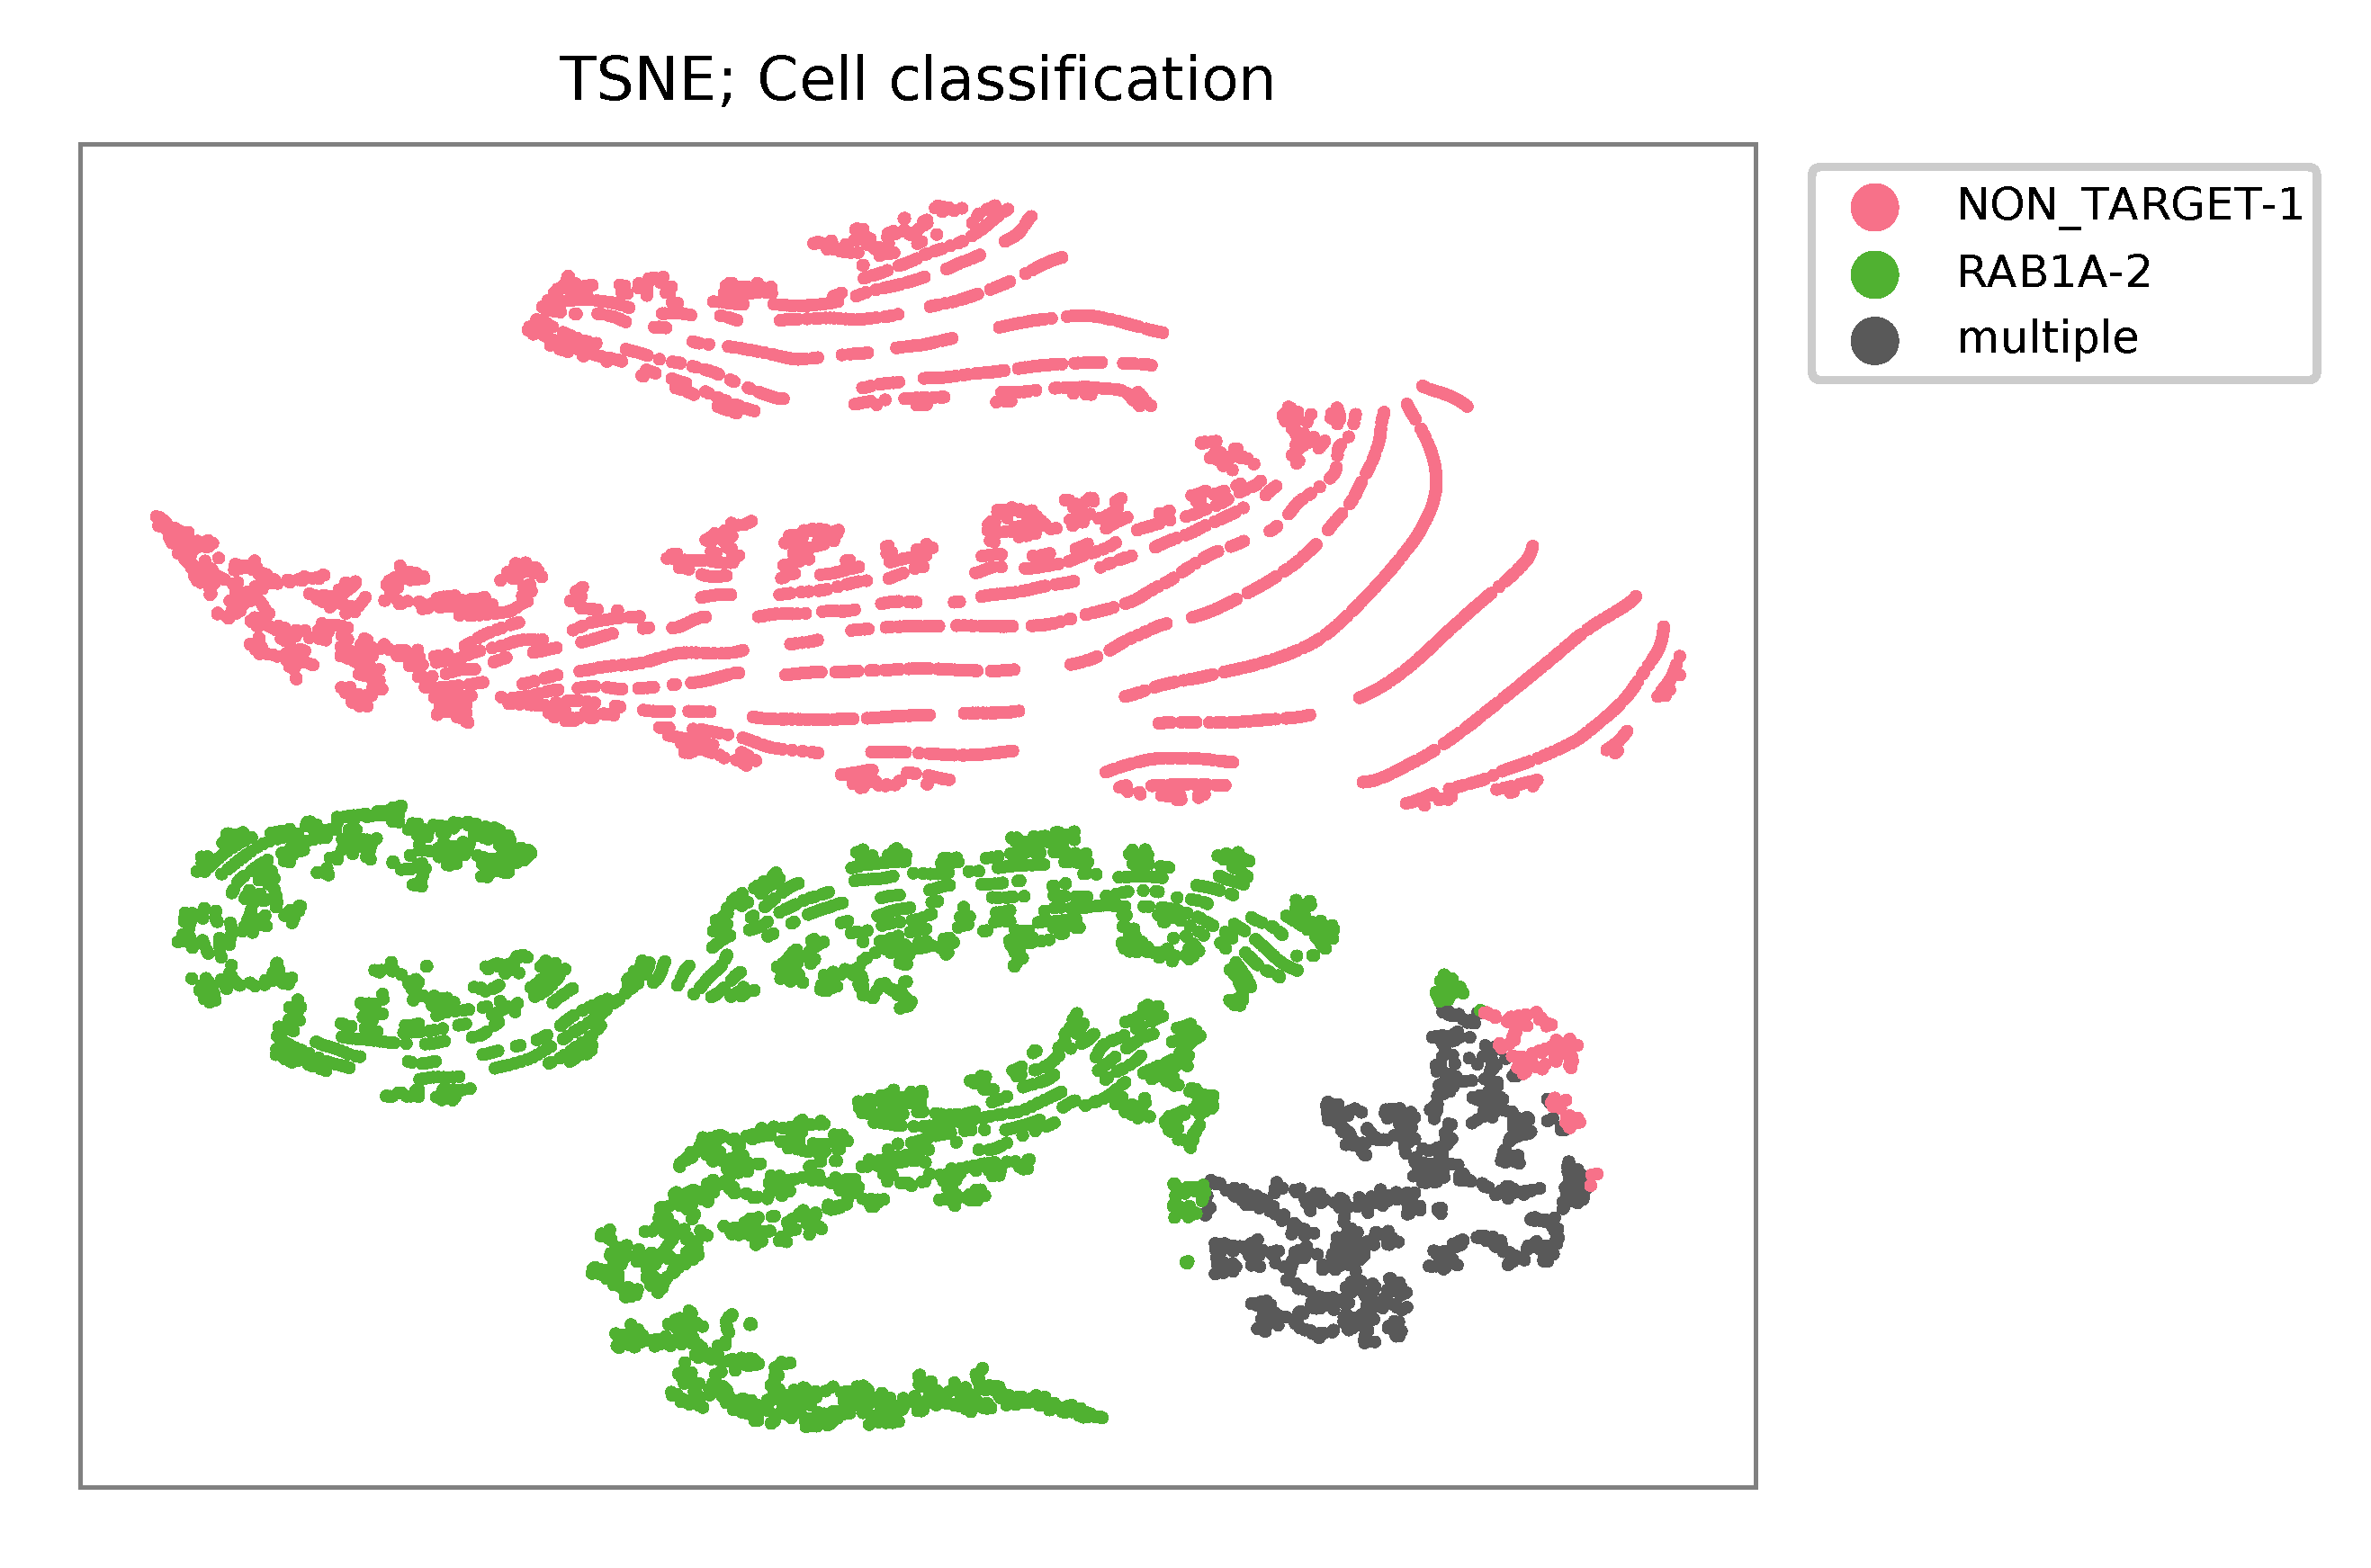
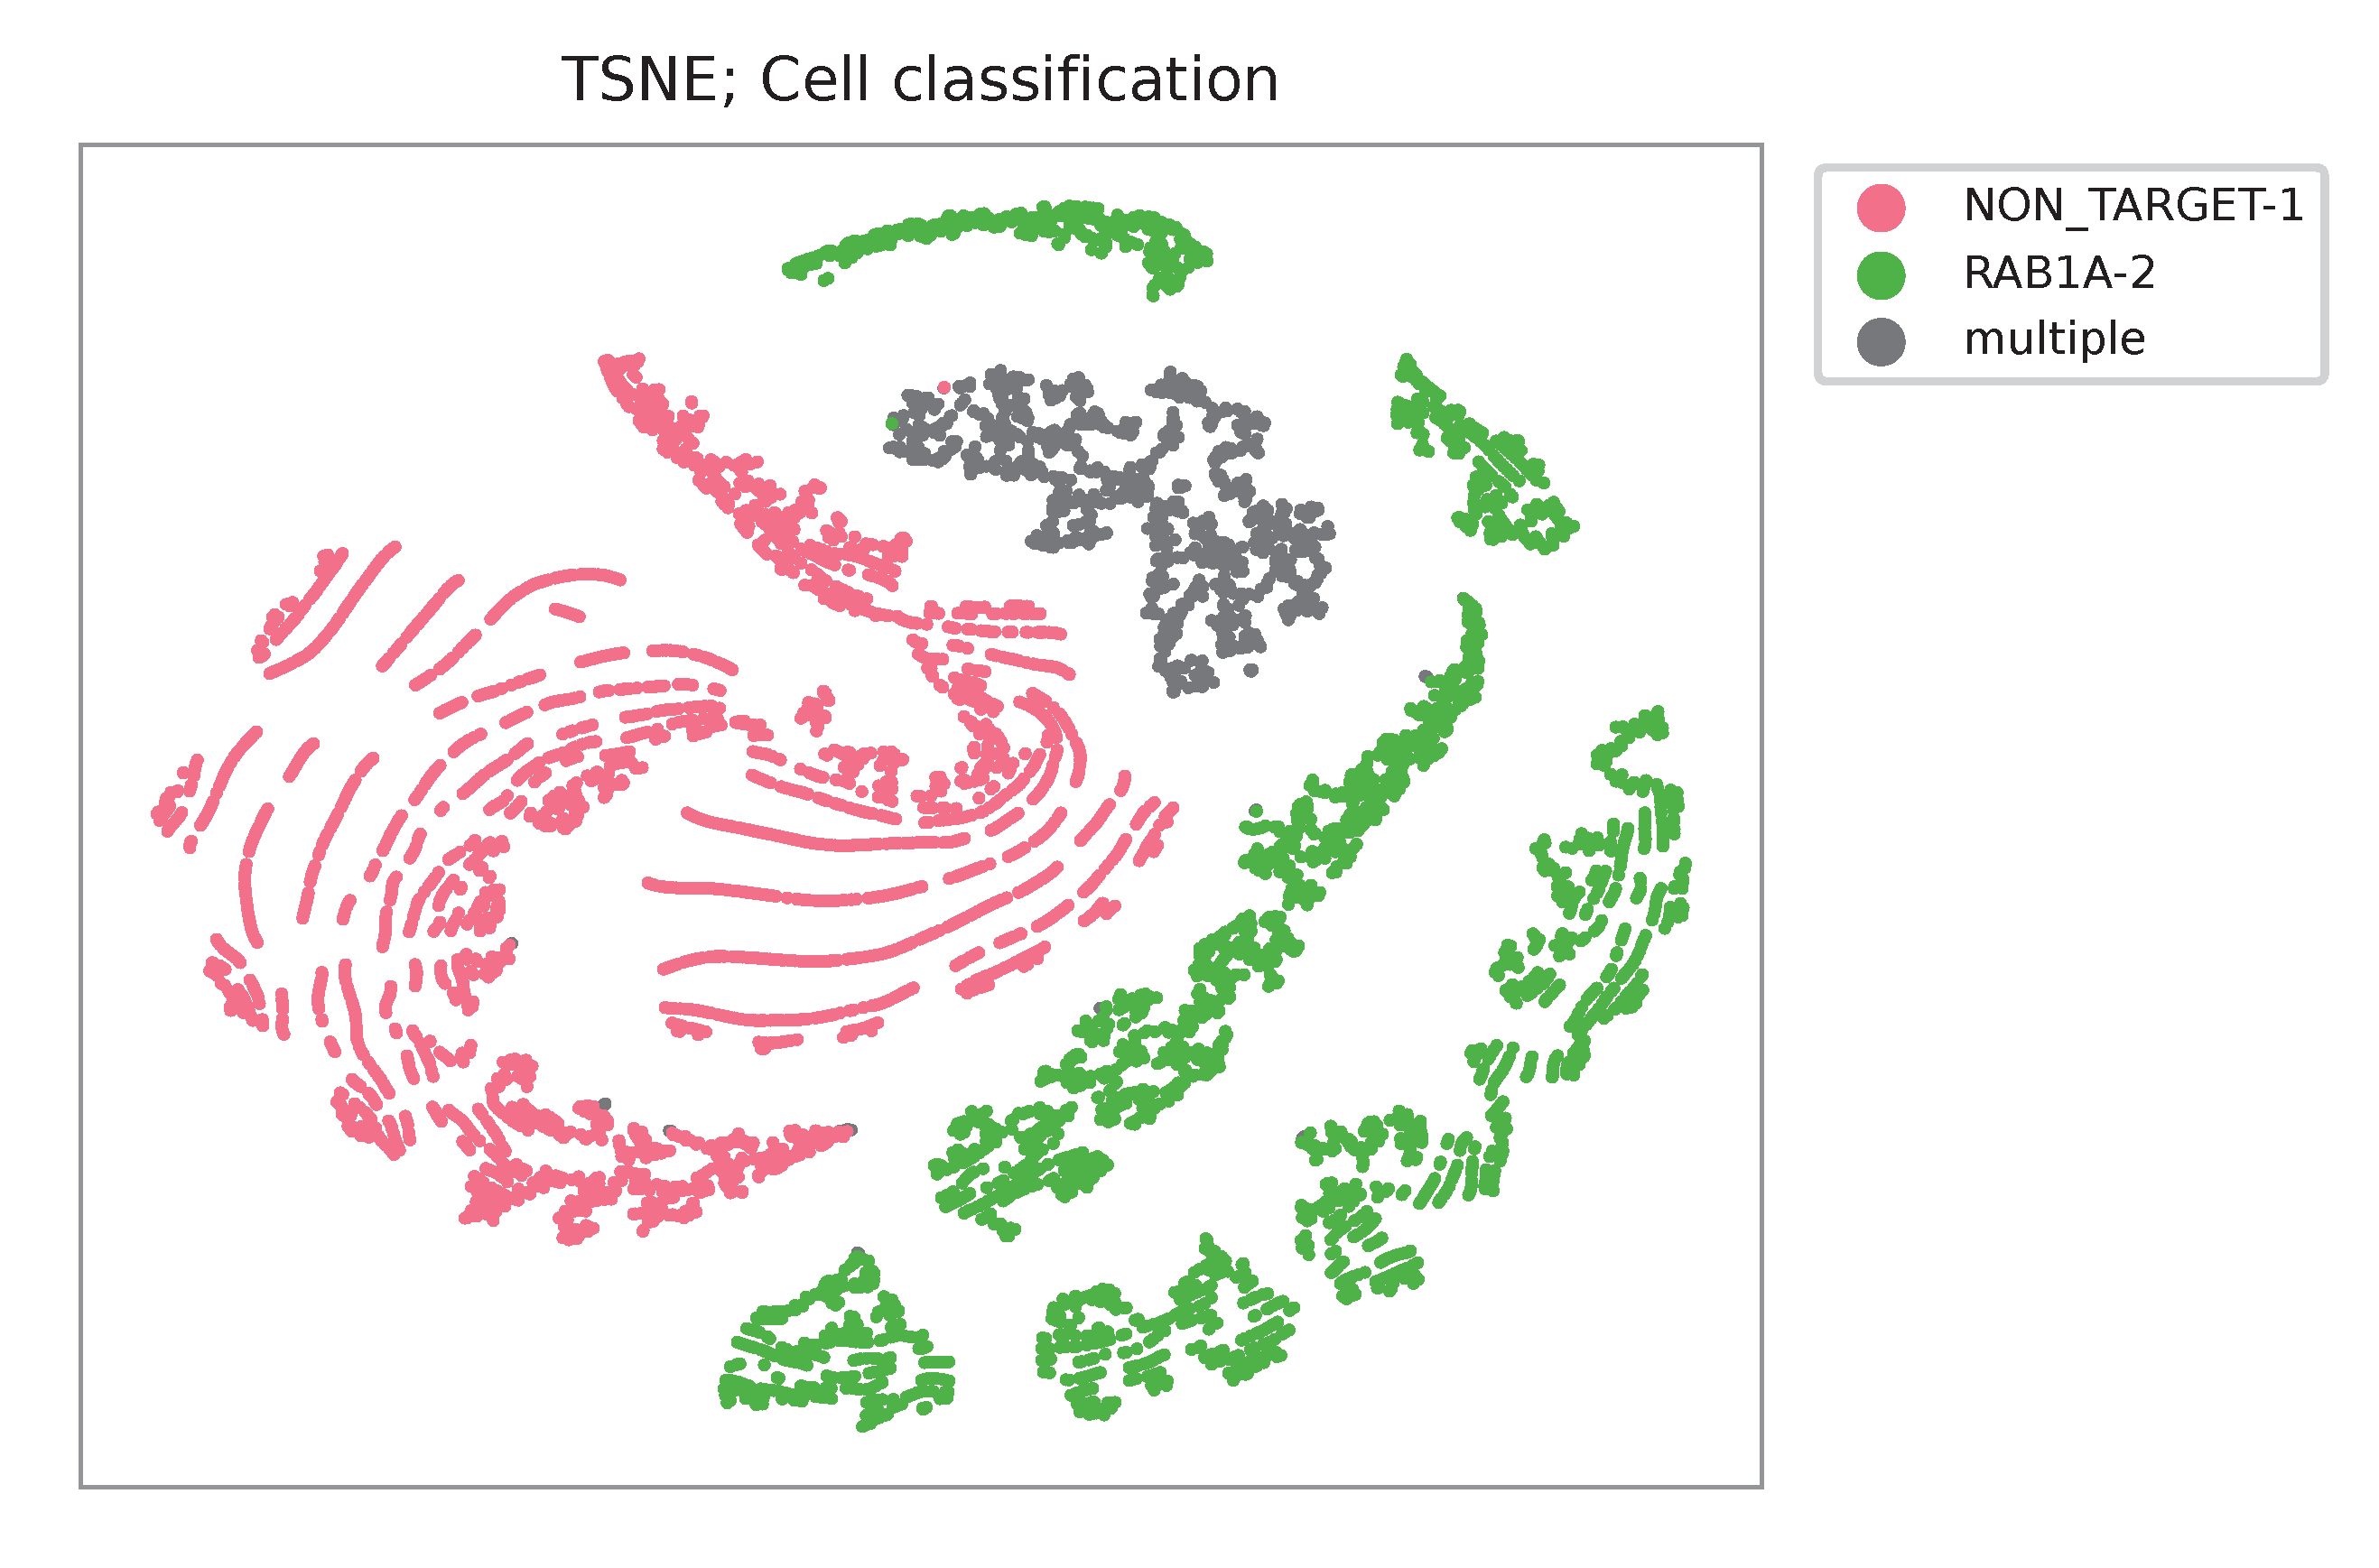
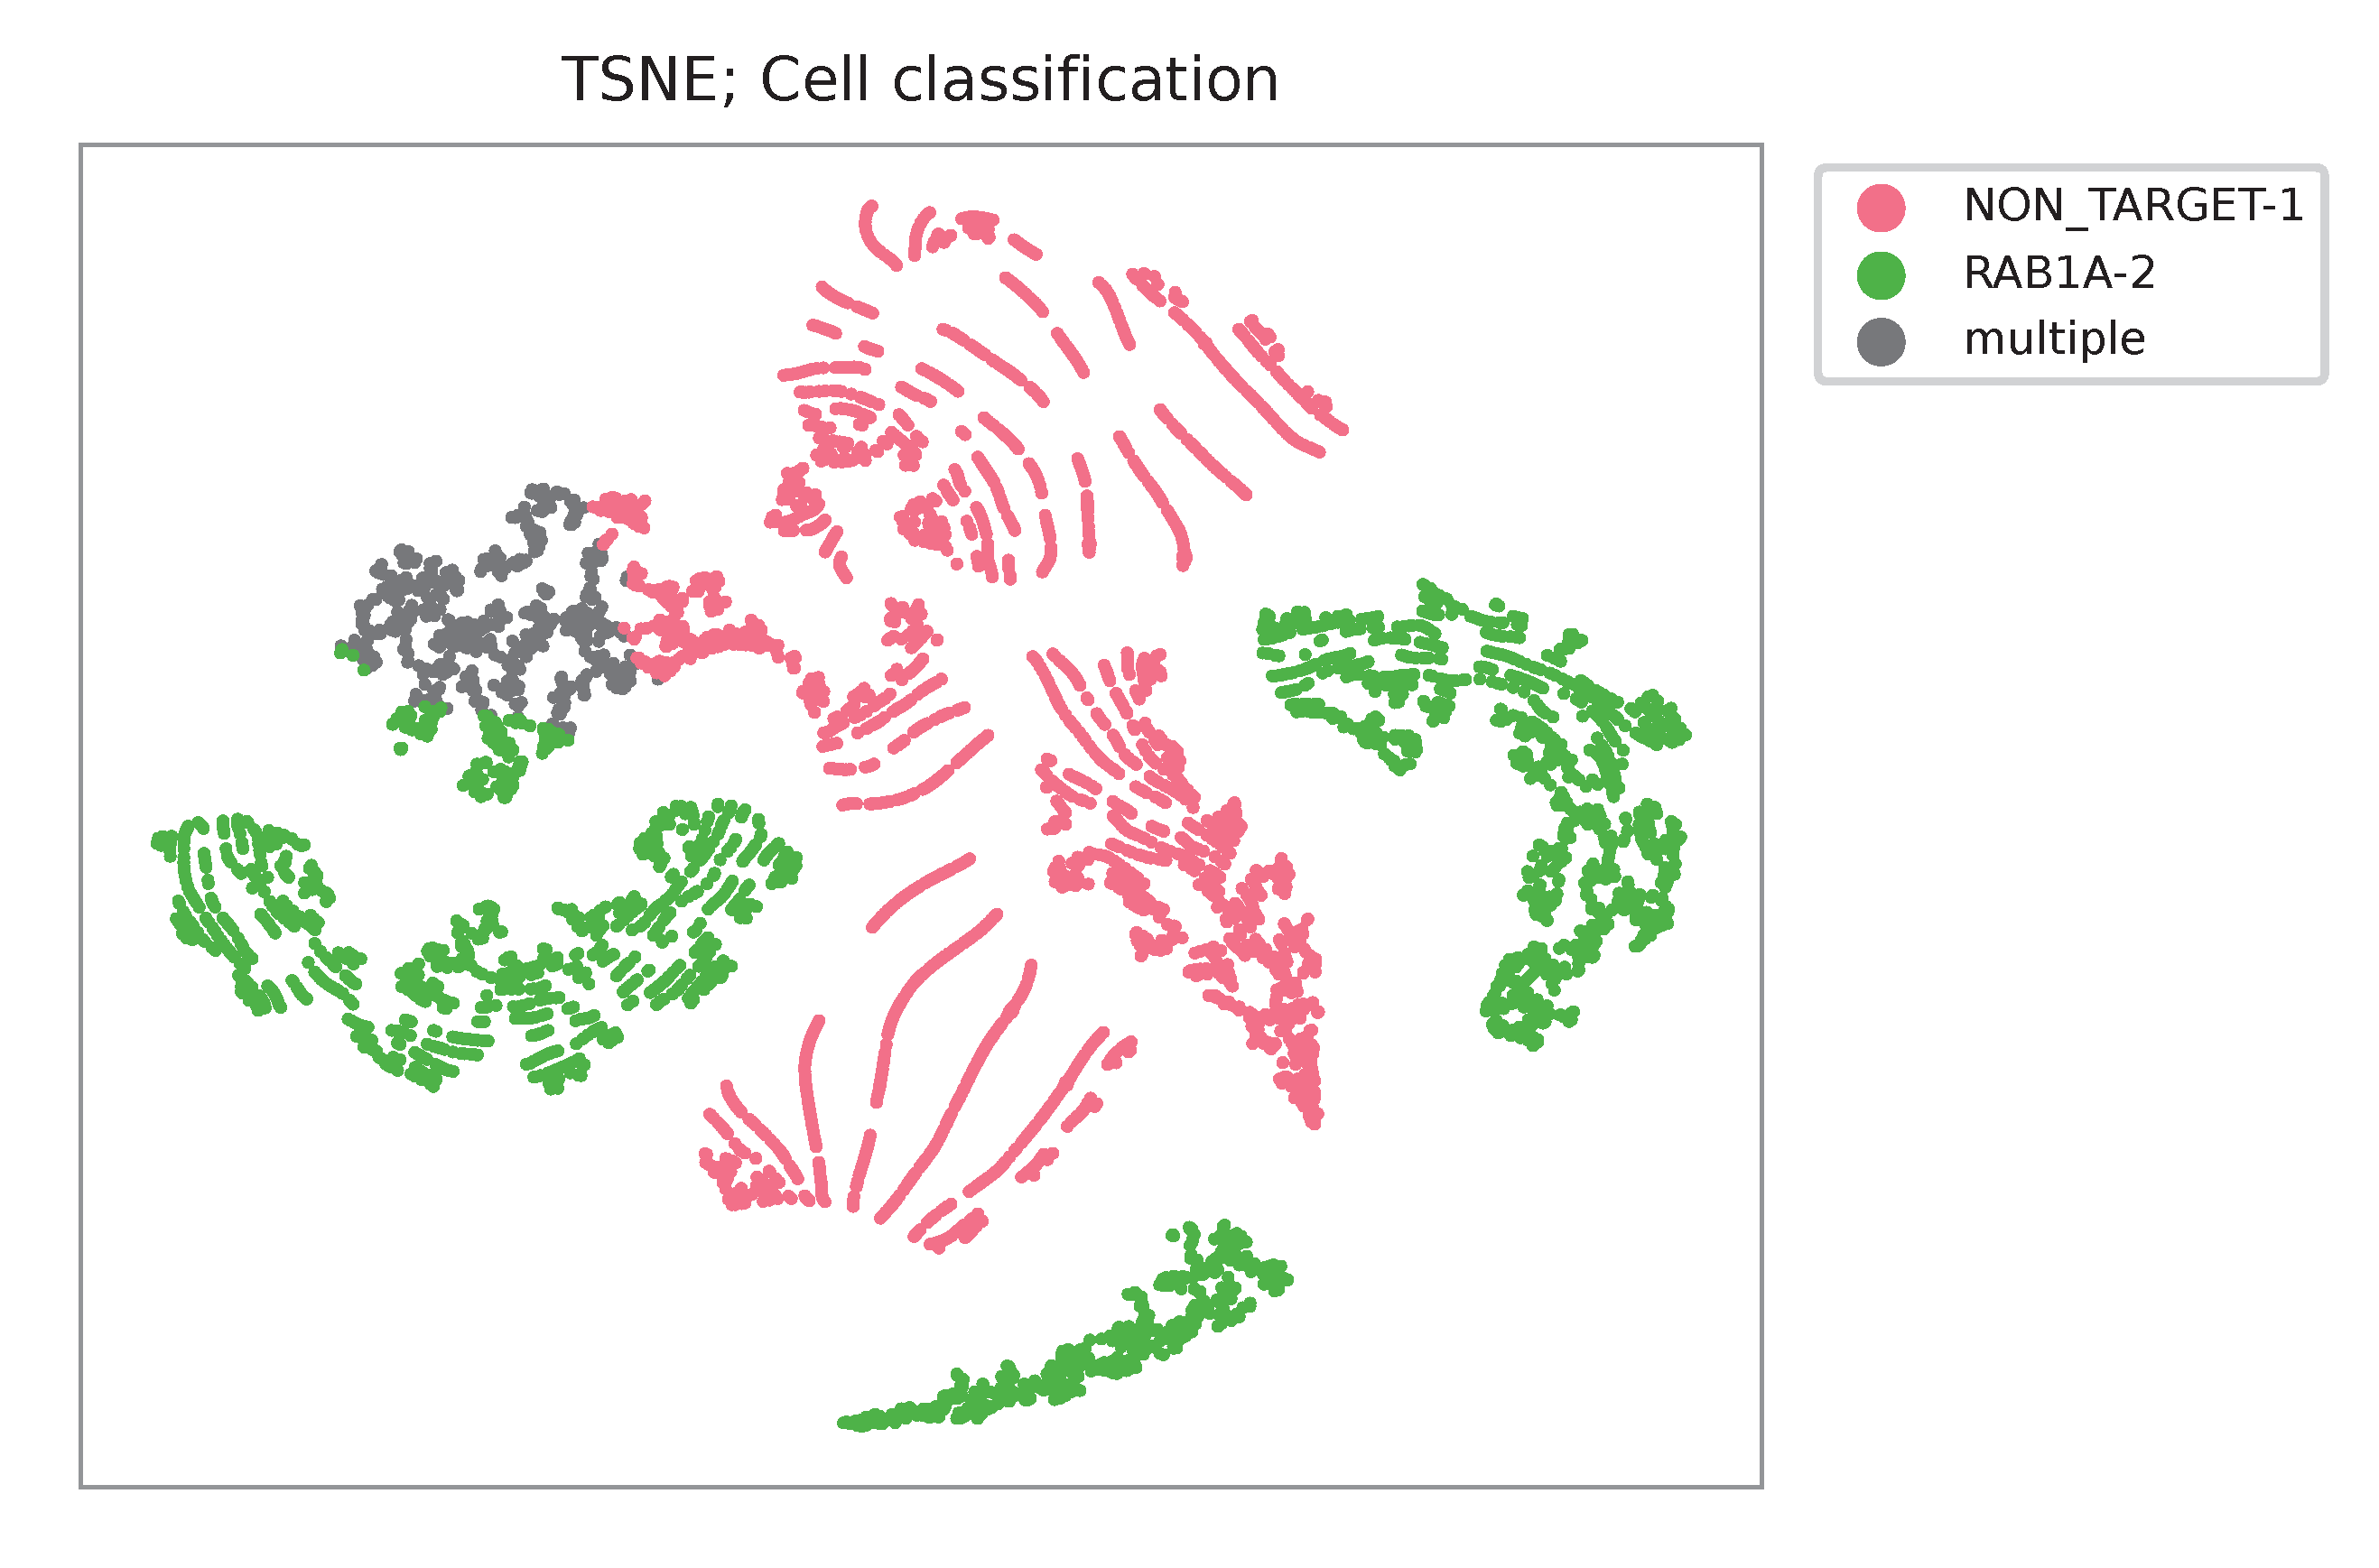
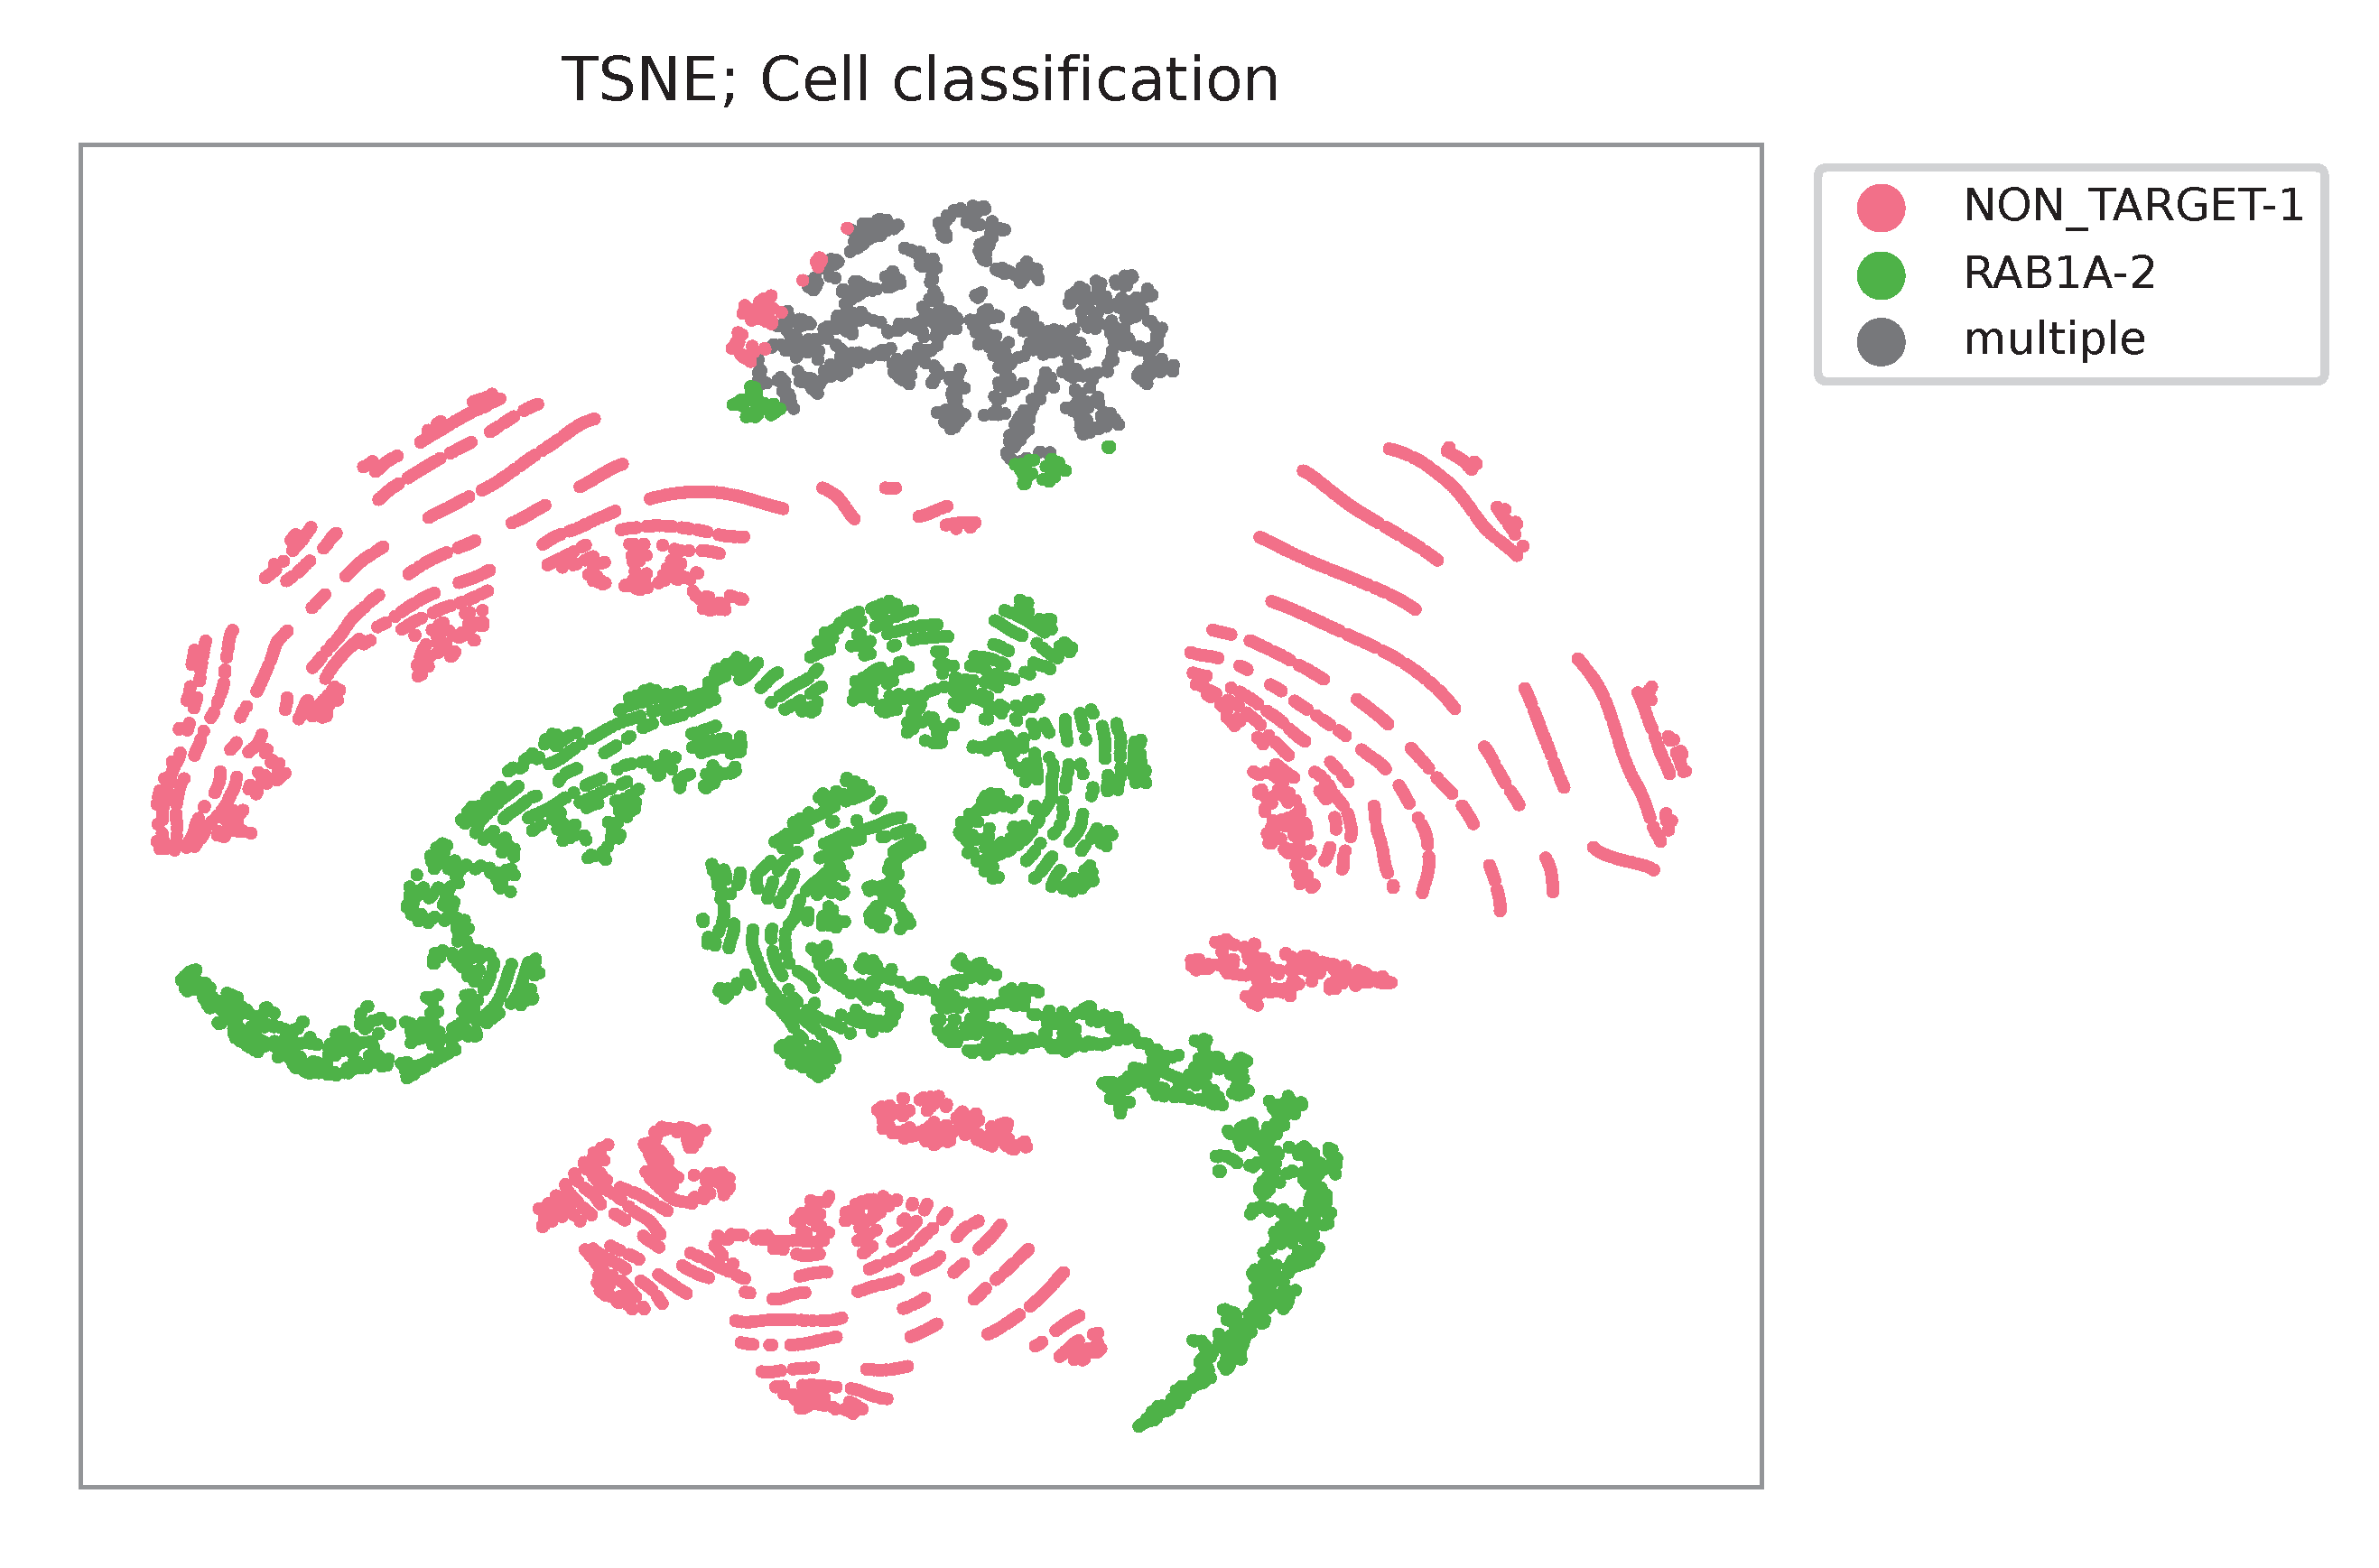
t-SNE embedding of cells based on the abundance of features (sgRNAs, no transcriptome information used). Colors indicate the sgRNA status for each cell, as called by FBA.
Gaussian mixture model
The implementation of demultiplexing method 2 (set by -dm) is inspired by the method described on 10x Genomics’ website. Use -p to set the probability threshold for demulitplexing (default 0.9).
$ fba demultiplex \
    -i matrix_featurecount.csv.gz \
    -dm 2 \
    -v
2021-10-04 14:14:15,659 - fba.__main__ - INFO - fba version: 0.0.x
2021-10-04 14:14:15,659 - fba.__main__ - INFO - Initiating logging ...
2021-10-04 14:14:15,659 - fba.__main__ - INFO - Python version: 3.8
2021-10-04 14:14:15,659 - fba.__main__ - INFO - Using demultiplex subcommand ...
2021-10-04 14:14:36,166 - fba.__main__ - INFO - Skipping arguments: "-q/--quantile", "-cm/--clustering_method"
2021-10-04 14:14:36,166 - fba.demultiplex - INFO - Output directory: demultiplexed
2021-10-04 14:14:36,166 - fba.demultiplex - INFO - Demultiplexing method: 2
2021-10-04 14:14:36,166 - fba.demultiplex - INFO - UMI normalization method: clr
2021-10-04 14:14:36,167 - fba.demultiplex - INFO - Visualization: On
2021-10-04 14:14:36,167 - fba.demultiplex - INFO - Visualization method: tsne
2021-10-04 14:14:36,167 - fba.demultiplex - INFO - Loading feature count matrix: matrix_featurecount.csv.gz ...
2021-10-04 14:14:37,875 - fba.demultiplex - INFO - Number of cells: 11,758
2021-10-04 14:14:37,875 - fba.demultiplex - INFO - Number of positive cells for a feature to be included: 200
2021-10-04 14:14:37,920 - fba.demultiplex - INFO - Number of features: 2 / 2 (after filtering / original in the matrix)
2021-10-04 14:14:37,920 - fba.demultiplex - INFO - Features: NON_TARGET-1 RAB1A-2
2021-10-04 14:14:37,920 - fba.demultiplex - INFO - Total UMIs: 7,145,799 / 7,145,799
2021-10-04 14:14:37,942 - fba.demultiplex - INFO - Median number of UMIs per cell: 477.0 / 477.0
2021-10-04 14:14:37,942 - fba.demultiplex - INFO - Demultiplexing ...
2021-10-04 14:14:38,418 - fba.demultiplex - INFO - Generating heatmap ...
2021-10-04 14:14:42,078 - fba.demultiplex - INFO - Embedding ...
2021-10-04 14:15:24,288 - fba.__main__ - INFO - Done.
Heatmap of the relative abundance of features (sgRNAs) across all cells. Each column represents a single cell.
t-SNE embedding of cells based on the abundance of features (sgRNAs, no transcriptome information used). Colors indicate the sgRNA status for each cell, as called by FBA.
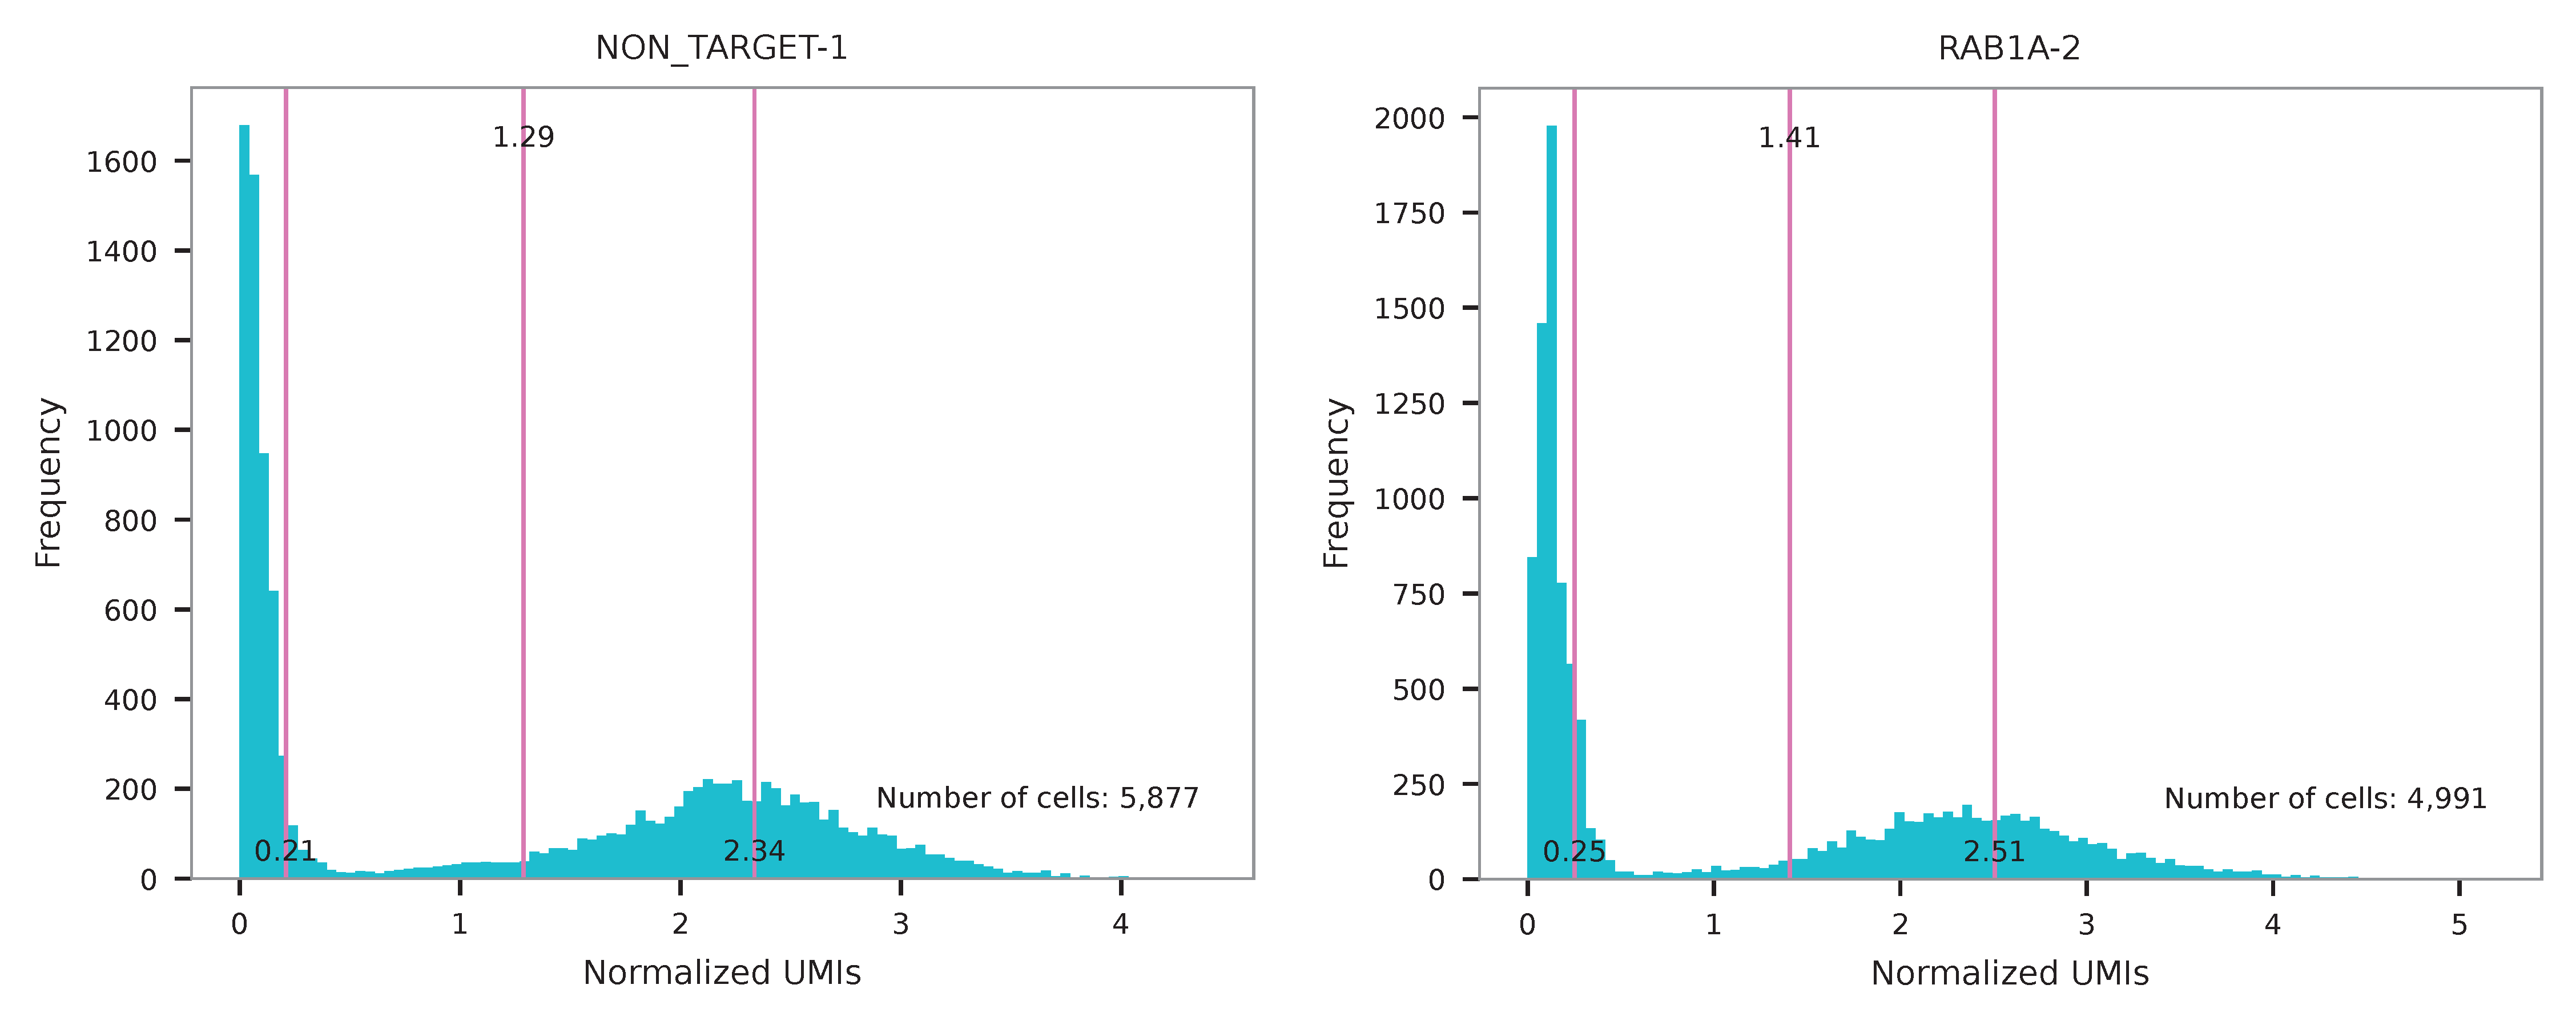
UMI distribution and model fitting threshold:

Poisson-Gaussian mixture model
The implementation of demultiplexing method 3 (set by -dm) is inspired by Replogle, M., et al. (2021). Use -p to set the probability threshold for demulitplexing (default 0.5).
$ fba demultiplex \
    -i matrix_featurecount.csv.gz \
    -dm 3 \
    -v
2021-12-20 00:13:17,443 - fba.__main__ - INFO - fba version: 0.0.x
2021-12-20 00:13:17,443 - fba.__main__ - INFO - Initiating logging ...
2021-12-20 00:13:17,443 - fba.__main__ - INFO - Python version: 3.9
2021-12-20 00:13:17,443 - fba.__main__ - INFO - Using demultiplex subcommand ...
2021-12-20 00:13:19,774 - fba.__main__ - INFO - Skipping arguments: "-q/--quantile", "-cm/--clustering_method"
2021-12-20 00:13:19,774 - fba.demultiplex - INFO - Output directory: demultiplexed
2021-12-20 00:13:19,774 - fba.demultiplex - INFO - Demultiplexing method: 3
2021-12-20 00:13:19,774 - fba.demultiplex - INFO - UMI normalization method: clr
2021-12-20 00:13:19,774 - fba.demultiplex - INFO - Visualization: On
2021-12-20 00:13:19,774 - fba.demultiplex - INFO - Visualization method: tsne
2021-12-20 00:13:19,774 - fba.demultiplex - INFO - Loading feature count matrix: matrix_featurecount.csv.gz ...
2021-12-20 00:13:20,479 - fba.demultiplex - INFO - Number of cells: 11,758
2021-12-20 00:13:20,479 - fba.demultiplex - INFO - Number of positive cells for a feature to be included: 200
2021-12-20 00:13:20,497 - fba.demultiplex - INFO - Number of features: 2 / 2 (after filtering / original in the matrix)
2021-12-20 00:13:20,497 - fba.demultiplex - INFO - Features: NON_TARGET-1 RAB1A-2
2021-12-20 00:13:20,497 - fba.demultiplex - INFO - Total UMIs: 7,145,799 / 7,145,799
2021-12-20 00:13:20,506 - fba.demultiplex - INFO - Median number of UMIs per cell: 477.0 / 477.0
2021-12-20 00:13:20,506 - fba.demultiplex - INFO - Demultiplexing ...
2021-12-20 00:13:21,930 - fba.demultiplex - INFO - Generating heatmap ...
2021-12-20 00:13:23,070 - fba.demultiplex - INFO - Embedding ...
2021-12-20 00:13:41,271 - fba.__main__ - INFO - Done.
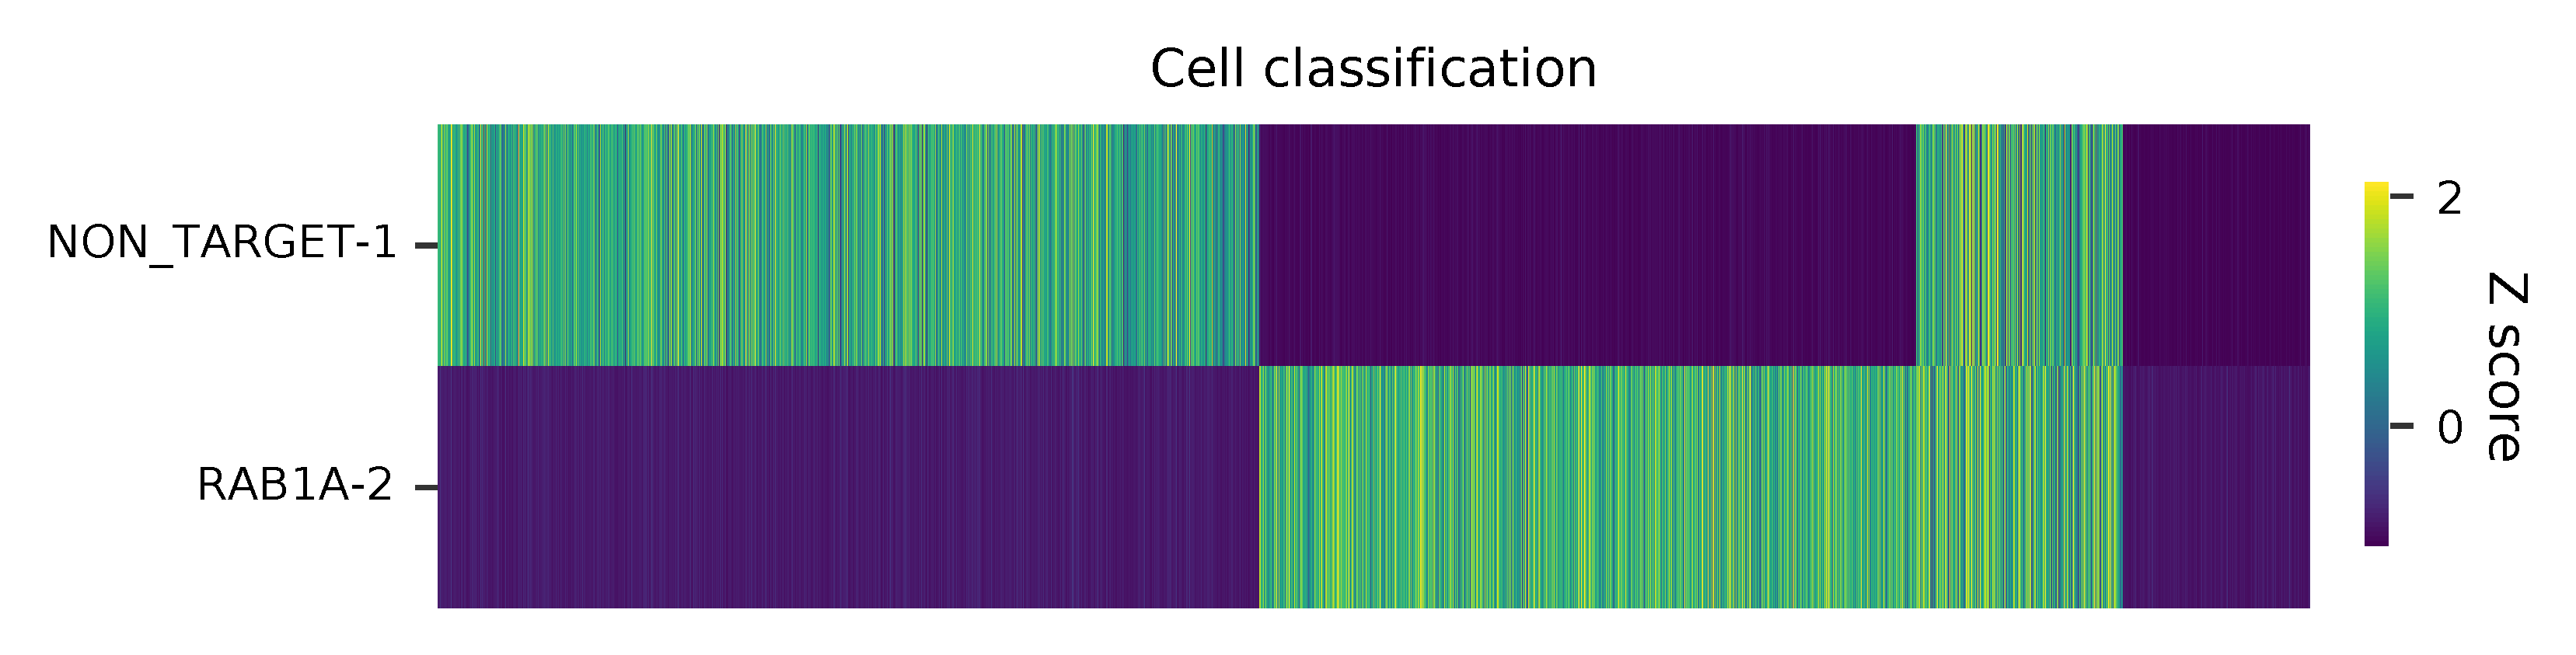
Heatmap of the relative abundance of features (sgRNAs) across all cells. Each column represents a single cell.
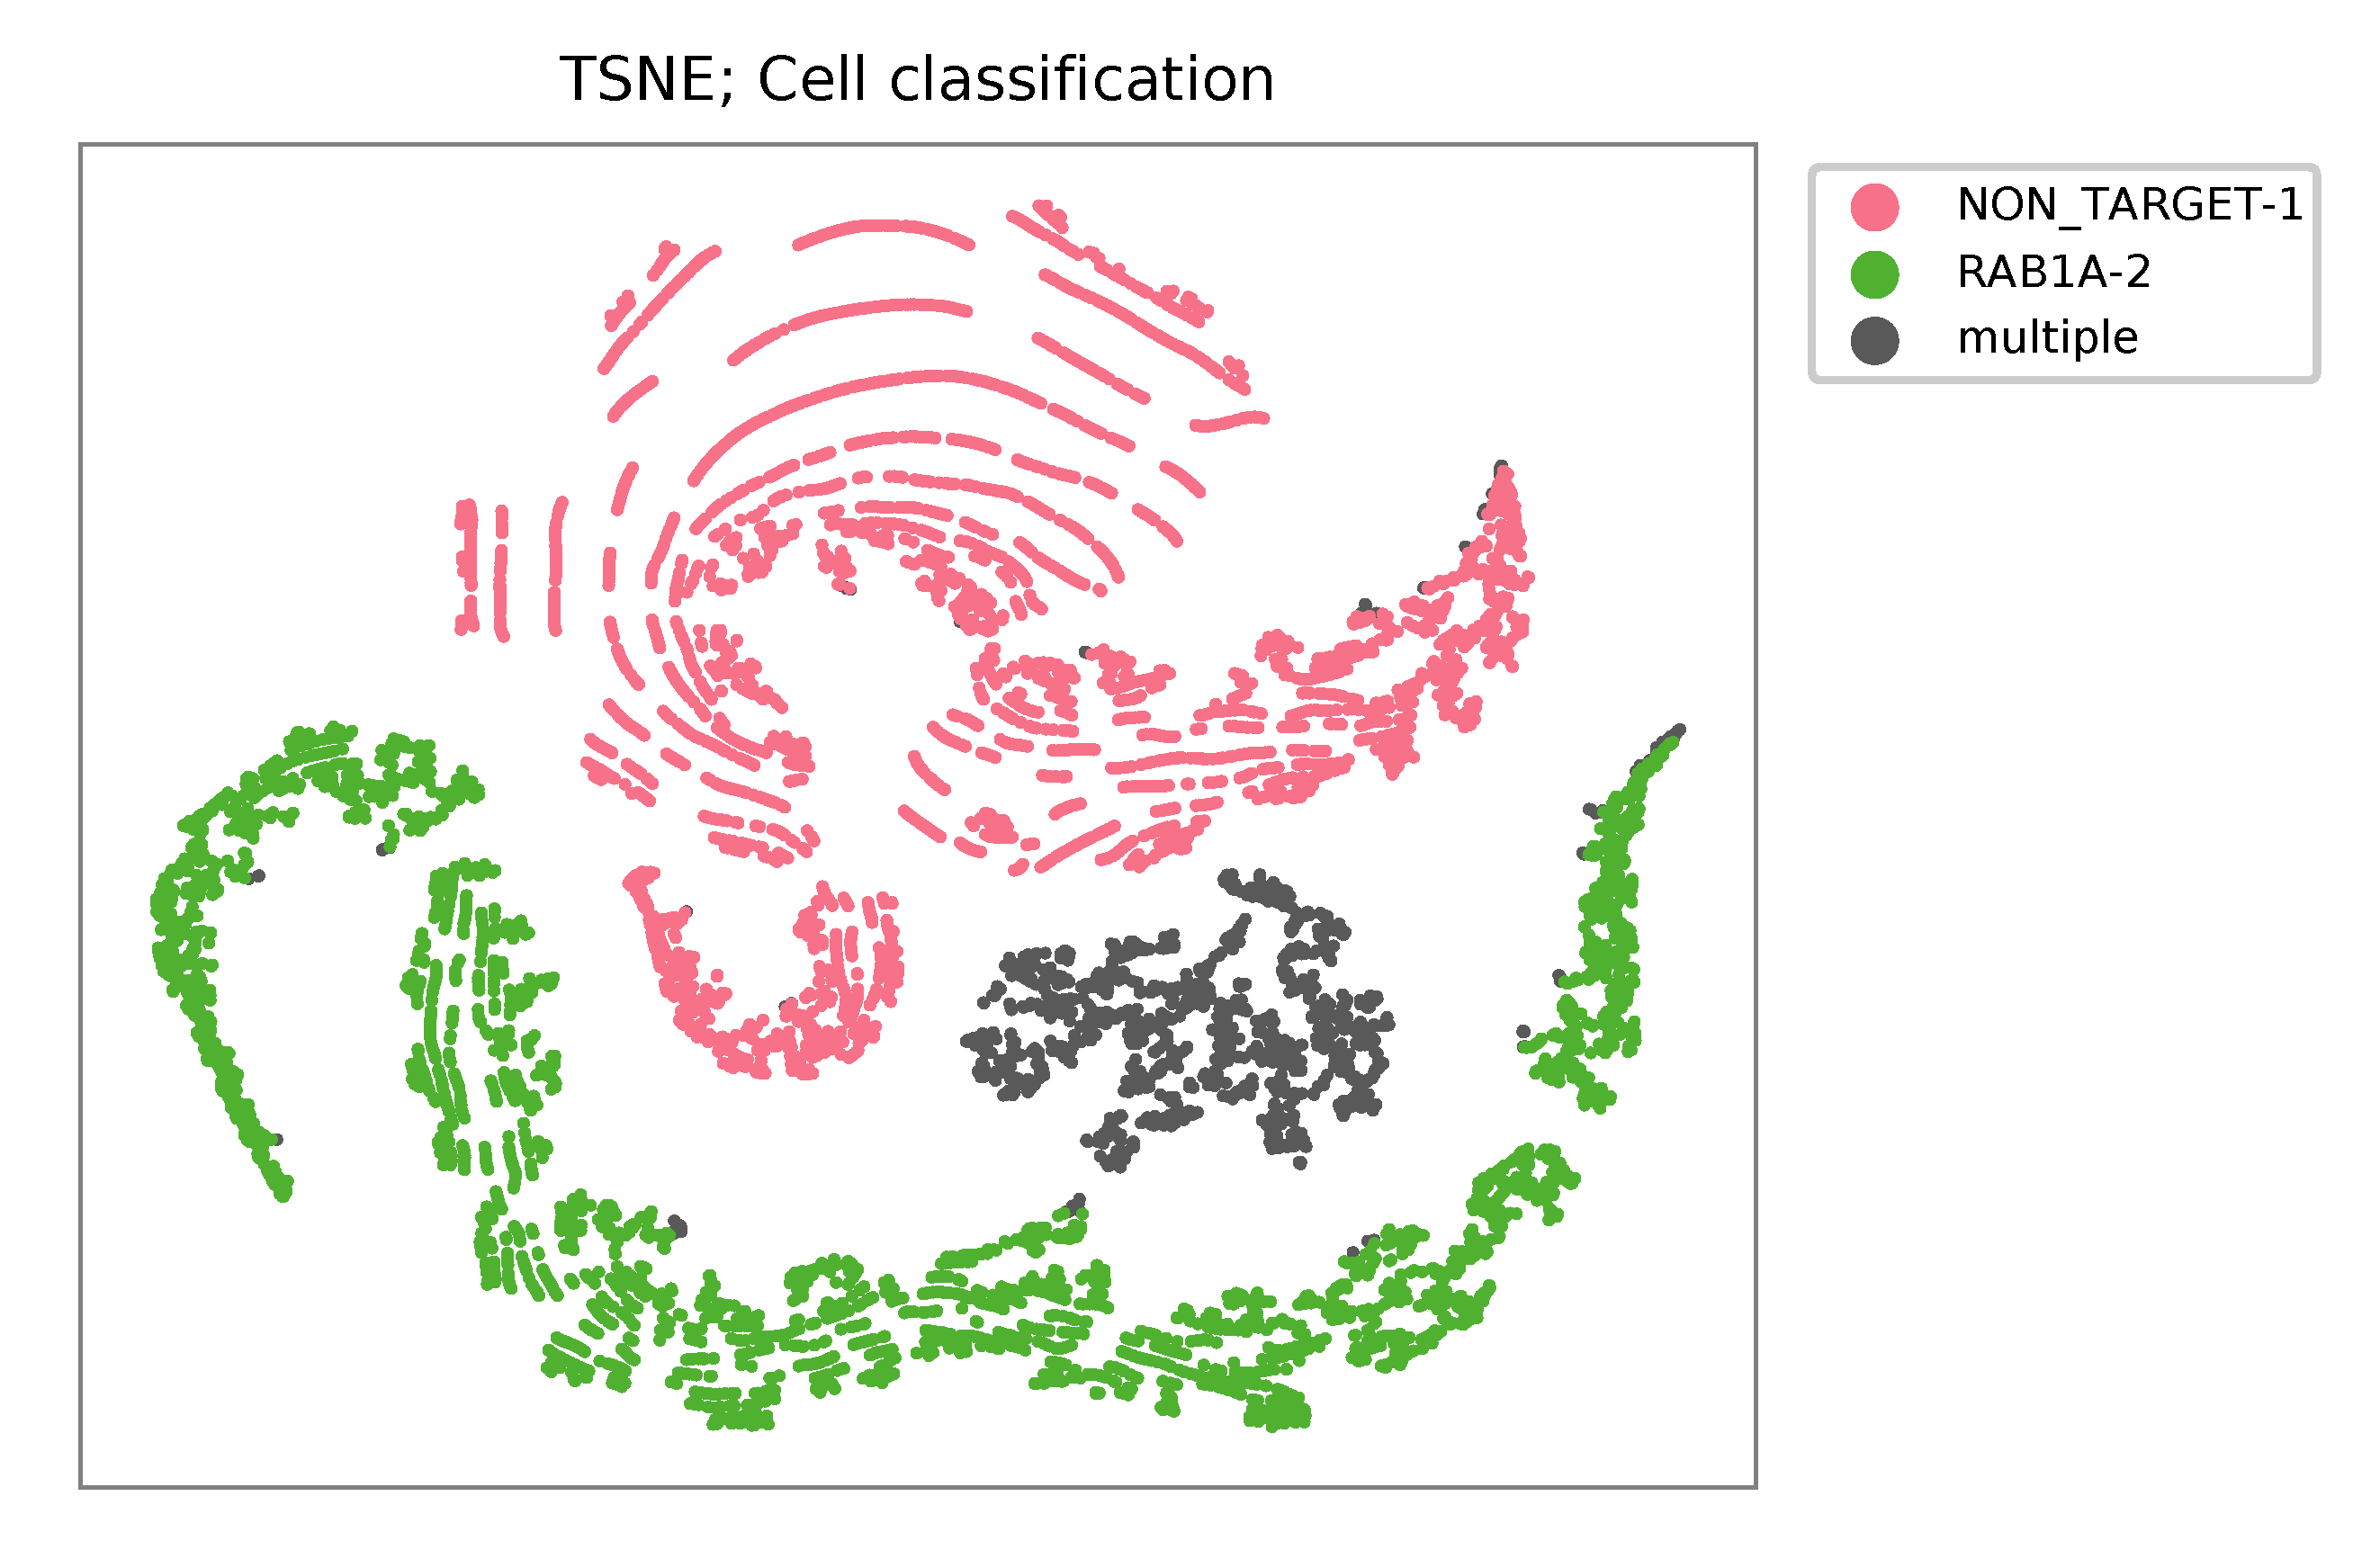
t-SNE embedding of cells based on the abundance of features (sgRNAs, no transcriptome information used). Colors indicate the sgRNA status for each cell, as called by FBA.
UMI distribution and model fitting threshold:
Kernel density estimation
CRISPR perturbatons are demultiplexed based on the abundance of features. Demultiplexing method 4 is implemented based on the method described in McGinnis, C., et al. (2019) with some modifications.
$ fba demultiplex \
    -i matrix_featurecount.csv.gz \
    -dm 4 \
    -v
2021-12-26 18:11:16,685 - fba.__main__ - INFO - fba version: 0.0.x
2021-12-26 18:11:16,685 - fba.__main__ - INFO - Initiating logging ...
2021-12-26 18:11:16,686 - fba.__main__ - INFO - Python version: 3.9
2021-12-26 18:11:16,686 - fba.__main__ - INFO - Using demultiplex subcommand ...
2021-12-26 18:11:19,633 - fba.__main__ - INFO - Skipping arguments: "-q/--quantile", "-cm/--clustering_method", "-p/--prob"
2021-12-26 18:11:19,633 - fba.demultiplex - INFO - Output directory: demultiplexed
2021-12-26 18:11:19,633 - fba.demultiplex - INFO - Demultiplexing method: 4
2021-12-26 18:11:19,633 - fba.demultiplex - INFO - UMI normalization method: clr
2021-12-26 18:11:19,633 - fba.demultiplex - INFO - Visualization: On
2021-12-26 18:11:19,633 - fba.demultiplex - INFO - Visualization method: tsne
2021-12-26 18:11:19,633 - fba.demultiplex - INFO - Loading feature count matrix: matrix_featurecount.csv.gz ...
2021-12-26 18:11:19,745 - fba.demultiplex - INFO - Number of cells: 11,758
2021-12-26 18:11:19,745 - fba.demultiplex - INFO - Number of positive cells for a feature to be included: 200
2021-12-26 18:11:19,762 - fba.demultiplex - INFO - Number of features: 2 / 2 (after filtering / original in the matrix)
2021-12-26 18:11:19,762 - fba.demultiplex - INFO - Features: NON_TARGET-1 RAB1A-2
2021-12-26 18:11:19,762 - fba.demultiplex - INFO - Total UMIs: 7,145,799 / 7,145,799
2021-12-26 18:11:19,771 - fba.demultiplex - INFO - Median number of UMIs per cell: 477.0 / 477.0
2021-12-26 18:11:19,771 - fba.demultiplex - INFO - Demultiplexing ...
2021-12-26 18:11:22,049 - fba.demultiplex - INFO - Quantile cutoff: 18
2021-12-26 18:11:23,703 - fba.demultiplex - INFO - Generating heatmap ...
2021-12-26 18:11:24,911 - fba.demultiplex - INFO - Embedding ...
2021-12-26 18:11:44,219 - fba.__main__ - INFO - Done.
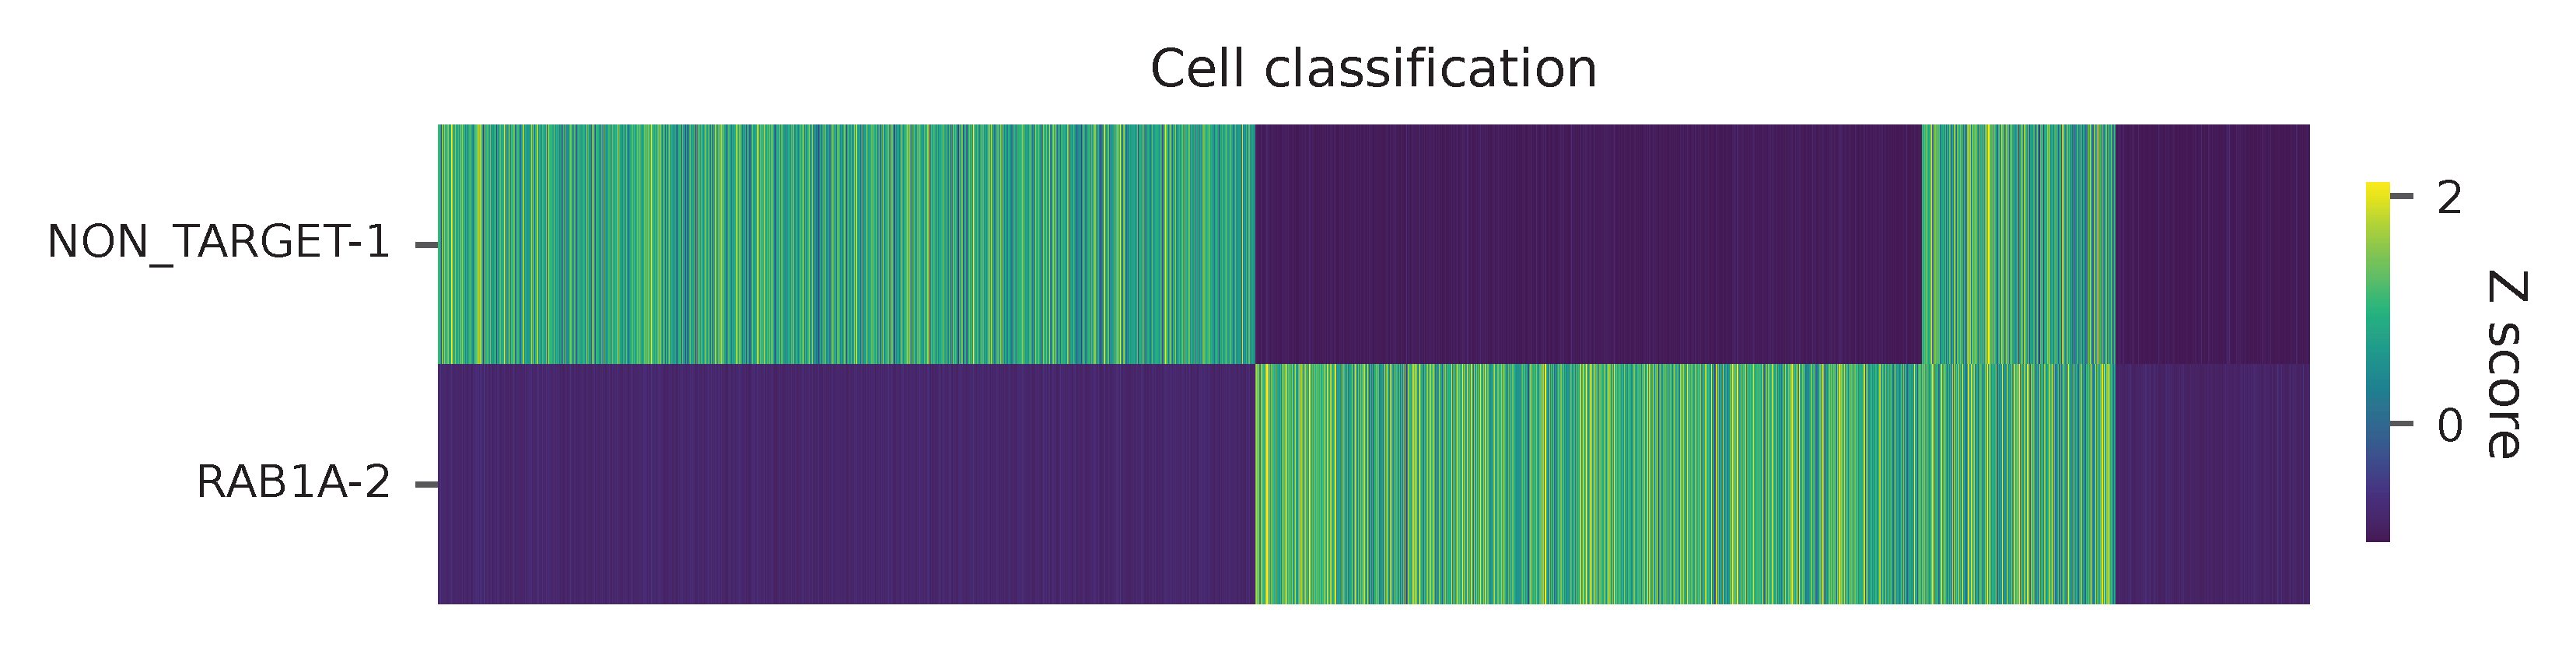
Heatmap of the relative abundance of features (sgRNAs) across all cells. Each column represents a single cell.
t-SNE embedding of cells based on the abundance of features (sgRNAs, no transcriptome information used). Colors indicate the sgRNA status for each cell, as called by FBA.
UMI distribution and model fitting threshold:

Knee point
Method 1
Cells are demultiplexed based on the abundance of features (sgRNAs). Demultiplexing method 5-2019 is our previous implementation, which tries to determine perturbations in the cells through the detection of inflection point on the feature UMI saturation curve (Xie, S., et al. (2019)).
$ fba demultiplex \
    -i matrix_featurecount.csv.gz \
    -dm 5-2019 \
    -v
2022-01-02 13:57:51,792 - fba.__main__ - INFO - fba version: 0.0.x
2022-01-02 13:57:51,792 - fba.__main__ - INFO - Initiating logging ...
2022-01-02 13:57:51,792 - fba.__main__ - INFO - Python version: 3.9
2022-01-02 13:57:51,792 - fba.__main__ - INFO - Using demultiplex subcommand ...
2022-01-02 13:57:54,328 - fba.__main__ - INFO - Skipping arguments: "-q/--quantile", "-cm/--clustering_method", "-p/--prob"
2022-01-02 13:57:54,329 - fba.demultiplex - INFO - Output directory: demultiplexed
2022-01-02 13:57:54,329 - fba.demultiplex - INFO - Demultiplexing method: 5-2019
2022-01-02 13:57:54,329 - fba.demultiplex - INFO - UMI normalization method: clr
2022-01-02 13:57:54,329 - fba.demultiplex - INFO - Visualization: On
2022-01-02 13:57:54,329 - fba.demultiplex - INFO - Visualization method: tsne
2022-01-02 13:57:54,329 - fba.demultiplex - INFO - Loading feature count matrix: raw/m2_2020-10-20/matrix_featurecount.csv.gz ...
2022-01-02 13:57:54,444 - fba.demultiplex - INFO - Number of cells: 11,758
2022-01-02 13:57:54,444 - fba.demultiplex - INFO - Number of positive cells for a feature to be included: 200
2022-01-02 13:57:54,464 - fba.demultiplex - INFO - Number of features: 2 / 2 (after filtering / original in the matrix)
2022-01-02 13:57:54,464 - fba.demultiplex - INFO - Features: NON_TARGET-1 RAB1A-2
2022-01-02 13:57:54,464 - fba.demultiplex - INFO - Total UMIs: 7,145,799 / 7,145,799
2022-01-02 13:57:54,474 - fba.demultiplex - INFO - Median number of UMIs per cell: 477.0 / 477.0
2022-01-02 13:57:54,474 - fba.demultiplex - INFO - Demultiplexing ...
2022-01-02 13:57:55,509 - fba.demultiplex - INFO - Generating heatmap ...
2022-01-02 13:57:56,717 - fba.demultiplex - INFO - Embedding ...
2022-01-02 13:58:12,014 - fba.__main__ - INFO - Done.
Heatmap of the relative abundance of features (sgRNAs) across all cells. Each column represents a single cell.
t-SNE embedding of cells based on the abundance of features (sgRNAs, no transcriptome information used). Colors indicate the sgRNA status for each cell, as called by FBA.
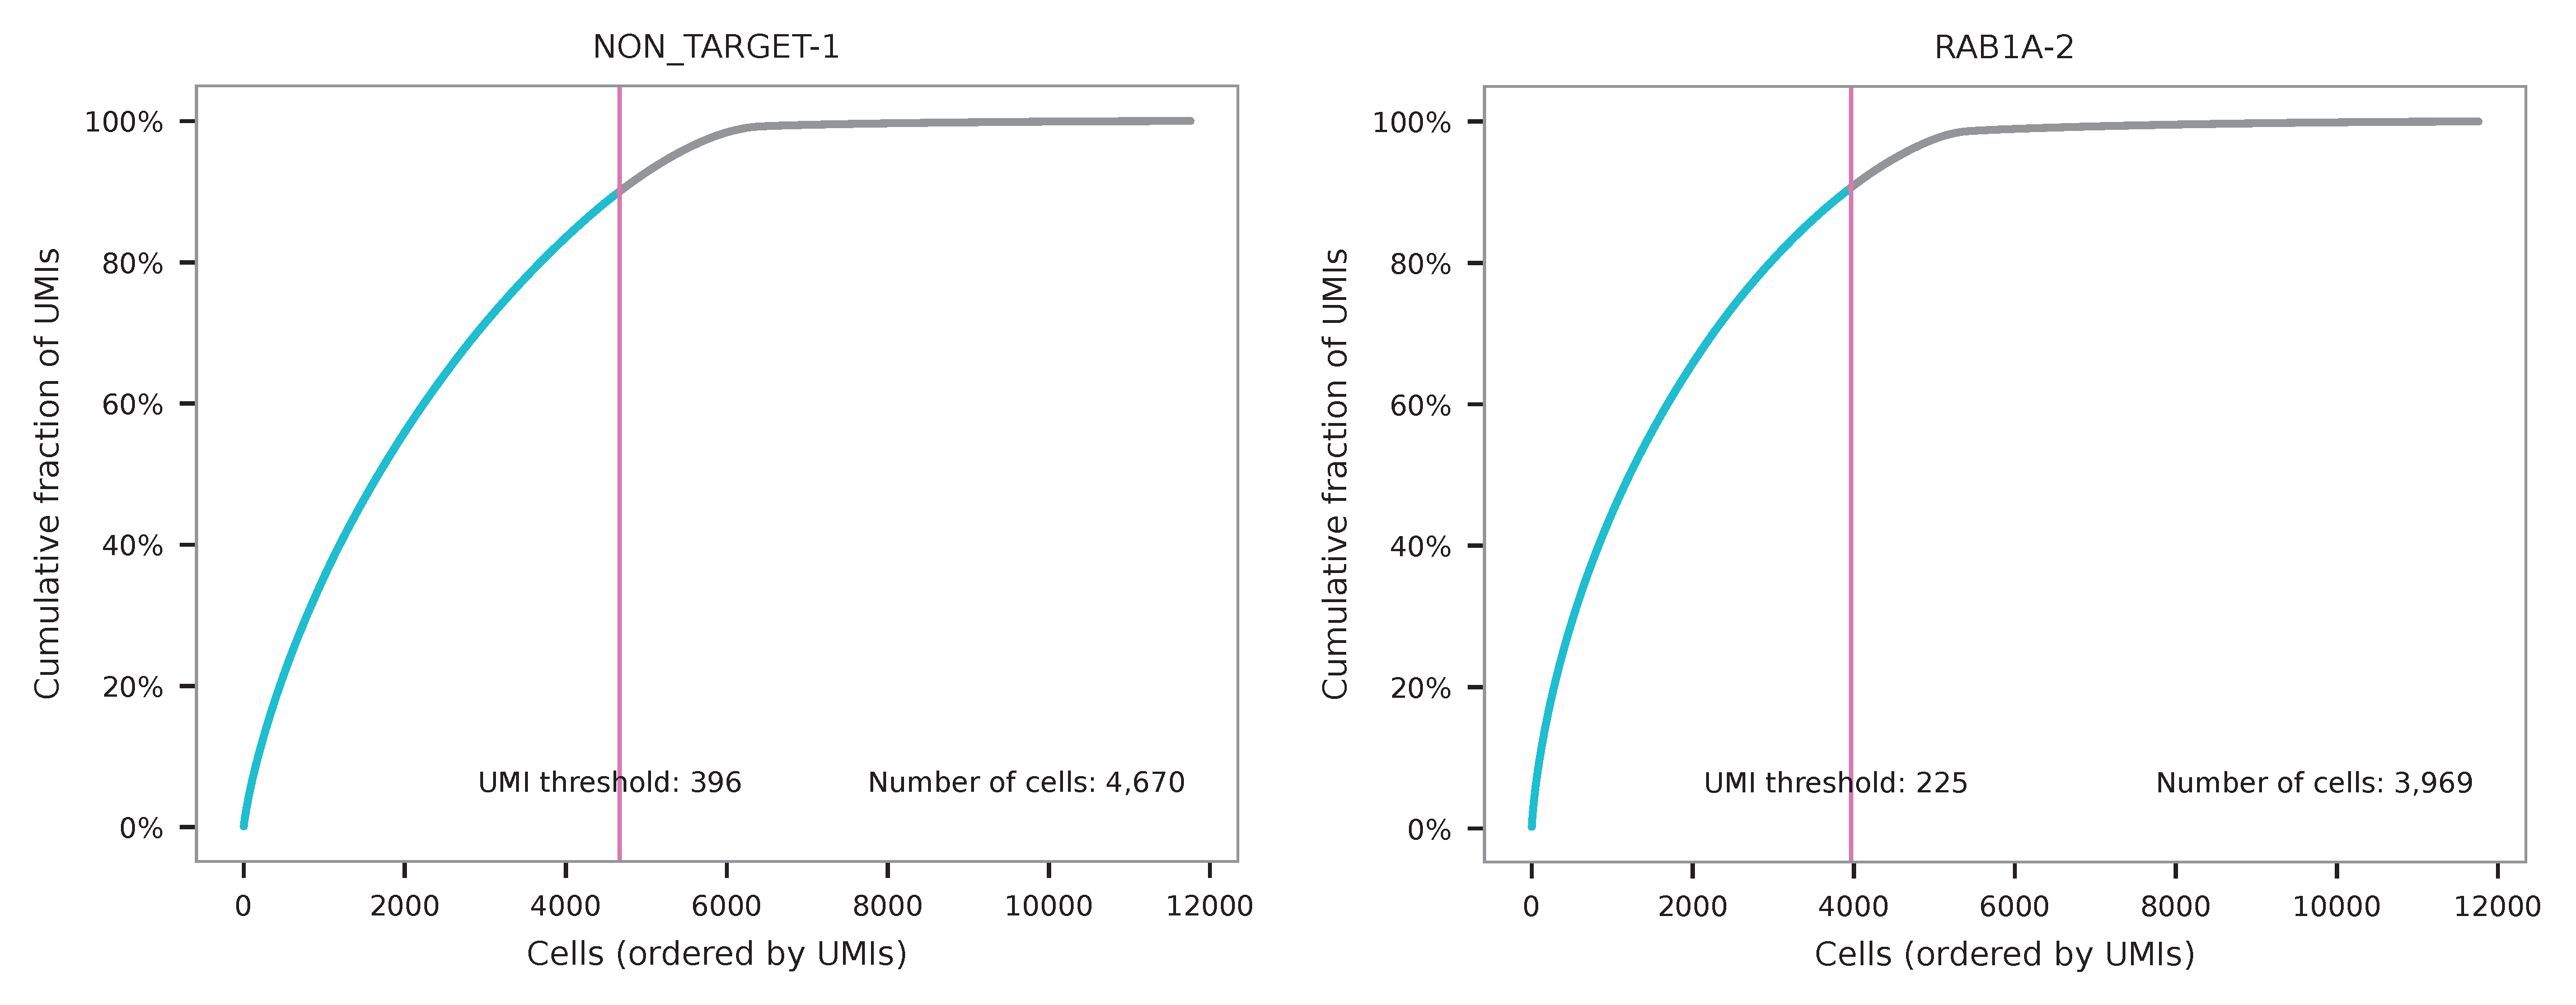
UMI distribution and knee point detection:
Method 2
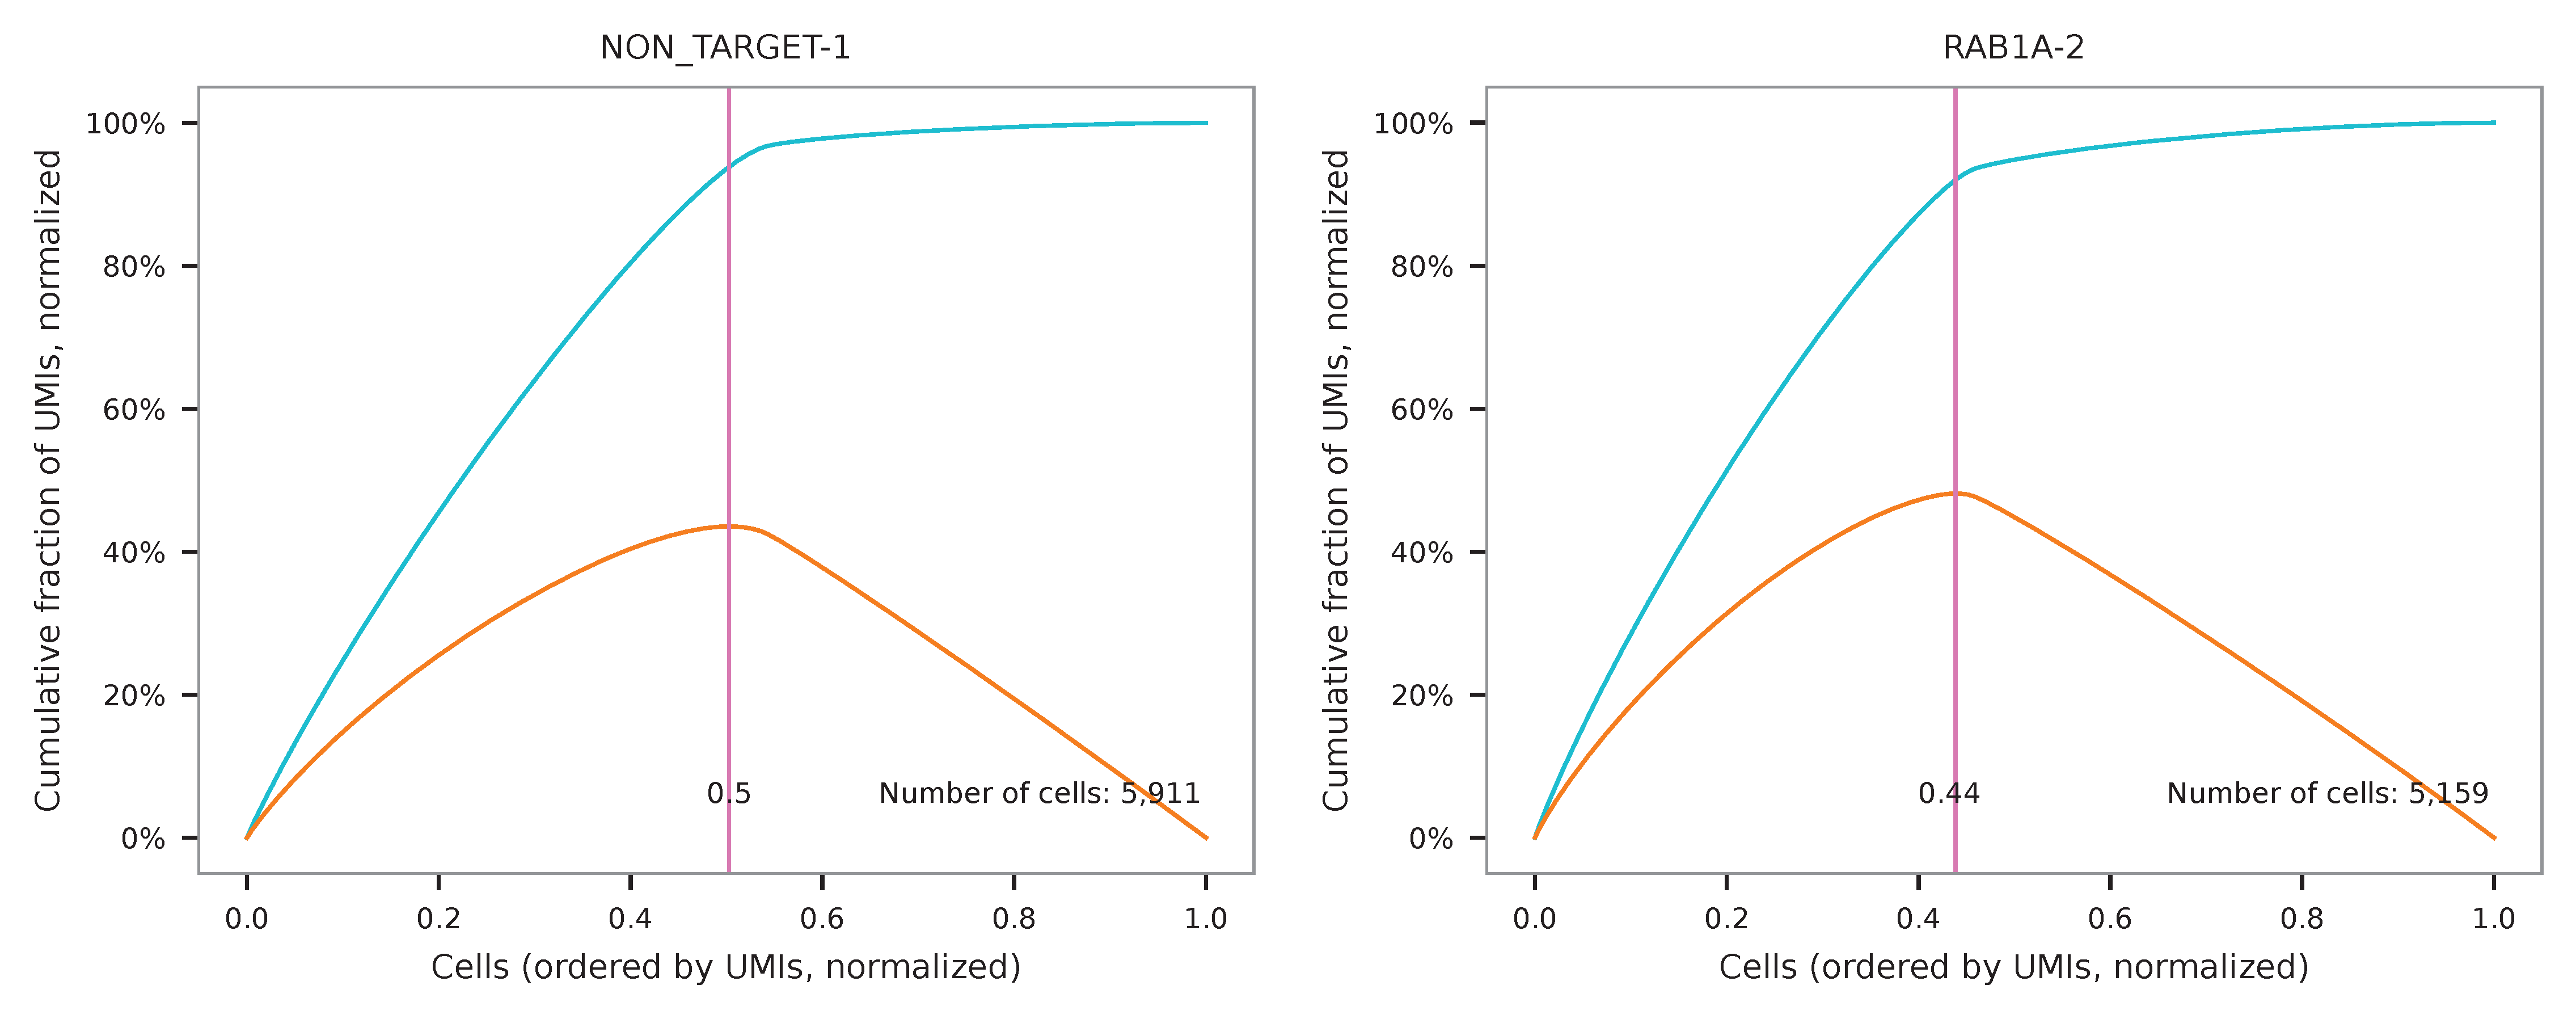
Cells are demultiplexed based on the abundance of features (sgRNAs). Demultiplexing method 5 is implemented to use the local maxima on the difference curve to detemine the knee point on the UMI saturation curve.
$ fba demultiplex \
    -i matrix_featurecount.csv.gz \
    -dm 5 \
    -v
2021-12-29 22:55:34,303 - fba.__main__ - INFO - fba version: 0.0.x
2021-12-29 22:55:34,303 - fba.__main__ - INFO - Initiating logging ...
2021-12-29 22:55:34,303 - fba.__main__ - INFO - Python version: 3.9
2021-12-29 22:55:34,303 - fba.__main__ - INFO - Using demultiplex subcommand ...
2021-12-29 22:55:36,774 - fba.__main__ - INFO - Skipping arguments: "-q/--quantile", "-cm/--clustering_method", "-p/--prob"
2021-12-29 22:55:36,774 - fba.demultiplex - INFO - Output directory: demultiplexed
2021-12-29 22:55:36,774 - fba.demultiplex - INFO - Demultiplexing method: 5
2021-12-29 22:55:36,774 - fba.demultiplex - INFO - UMI normalization method: clr
2021-12-29 22:55:36,774 - fba.demultiplex - INFO - Visualization: On
2021-12-29 22:55:36,774 - fba.demultiplex - INFO - Visualization method: tsne
2021-12-29 22:55:36,774 - fba.demultiplex - INFO - Loading feature count matrix: matrix_featurecount.csv.gz ...
2021-12-29 22:55:36,886 - fba.demultiplex - INFO - Number of cells: 11,758
2021-12-29 22:55:36,886 - fba.demultiplex - INFO - Number of positive cells for a feature to be included: 200
2021-12-29 22:55:36,904 - fba.demultiplex - INFO - Number of features: 2 / 2 (after filtering / original in the matrix)
2021-12-29 22:55:36,904 - fba.demultiplex - INFO - Features: NON_TARGET-1 RAB1A-2
2021-12-29 22:55:36,904 - fba.demultiplex - INFO - Total UMIs: 7,145,799 / 7,145,799
2021-12-29 22:55:36,913 - fba.demultiplex - INFO - Median number of UMIs per cell: 477.0 / 477.0
2021-12-29 22:55:36,913 - fba.demultiplex - INFO - Demultiplexing ...
2021-12-29 22:55:37,415 - fba.demultiplex - INFO - Generating heatmap ...
2021-12-29 22:55:38,576 - fba.demultiplex - INFO - Embedding ...
2021-12-29 22:55:57,485 - fba.__main__ - INFO - Done.
Heatmap of the relative abundance of features (sgRNAs) across all cells. Each column represents a single cell.
t-SNE embedding of cells based on the abundance of features (sgRNAs, no transcriptome information used). Colors indicate the sgRNA status for each cell, as called by FBA.
UMI distribution and knee point detection: